opening page ornament

The Australian Centre for Student Equity and Success acknowledges Indigenous peoples across Australia as the Traditional Owners of the lands on which the nation’s campuses are situated. With a history spanning more than 60,000 years as the original educators, Indigenous peoples hold a unique place in our nation. We recognise the importance of their knowledge and culture, and reflect the principles of participation, equity, and cultural respect in our work. We pay our respects to Elders past, present, and future, and consider it an honour to learn from our Indigenous colleagues, partners, and friends.

You are reading: New report highlights need to take a deeper look at university retention

The number of students returning to university after their first year of study increased among all key equity groups in 2024, according to a new report by the Australian Centre for Student Equity and Success (ACSES).

But there remained significant variability between individual equity groups, while “non-equity” students continued to record markedly higher first-year retention rates.

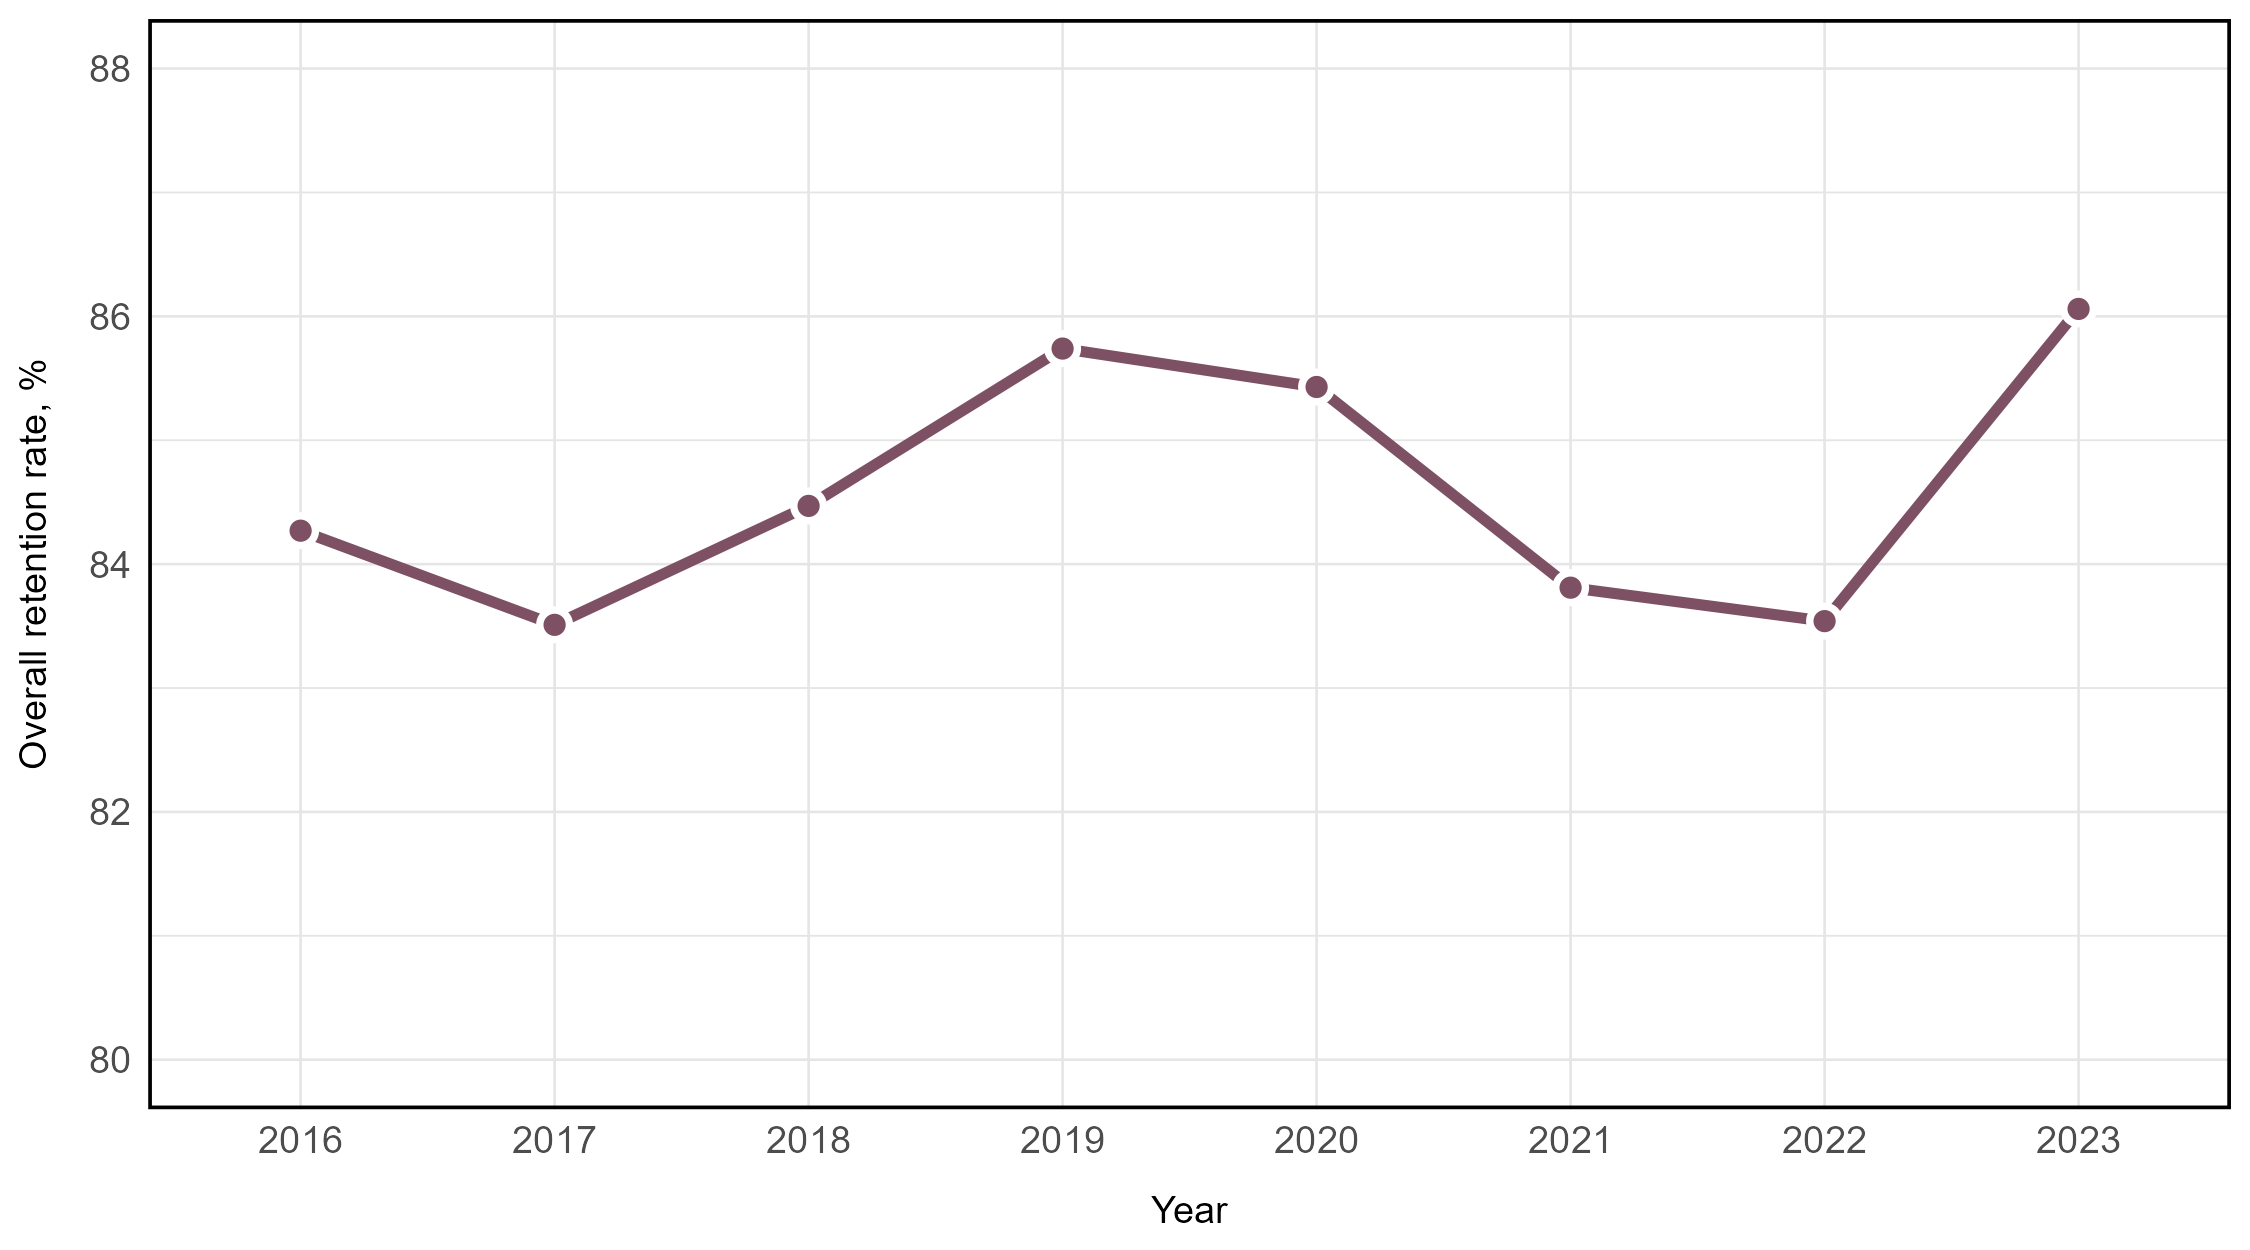
Drawing on the latest available figures, the report—part of ACSES’s Data Insights Series—revealed the overall first-year student retention rate grew by 2.6 percentage points to more than 86% nationwide in 2023 (students returning in 2024).

A line graph showing the retention rate of domestic undergraduate students between 2016 and 2023 enrolled at Table A universities. Year is plotted on the x axis and retention rate is plotted on the y-axis. The chart shows that in 2016, retention was at 84.3%, and steadily increased to 85.7% in 2019, decreased to 83.5% in 2022, and increasing to 86.1% in 2023.

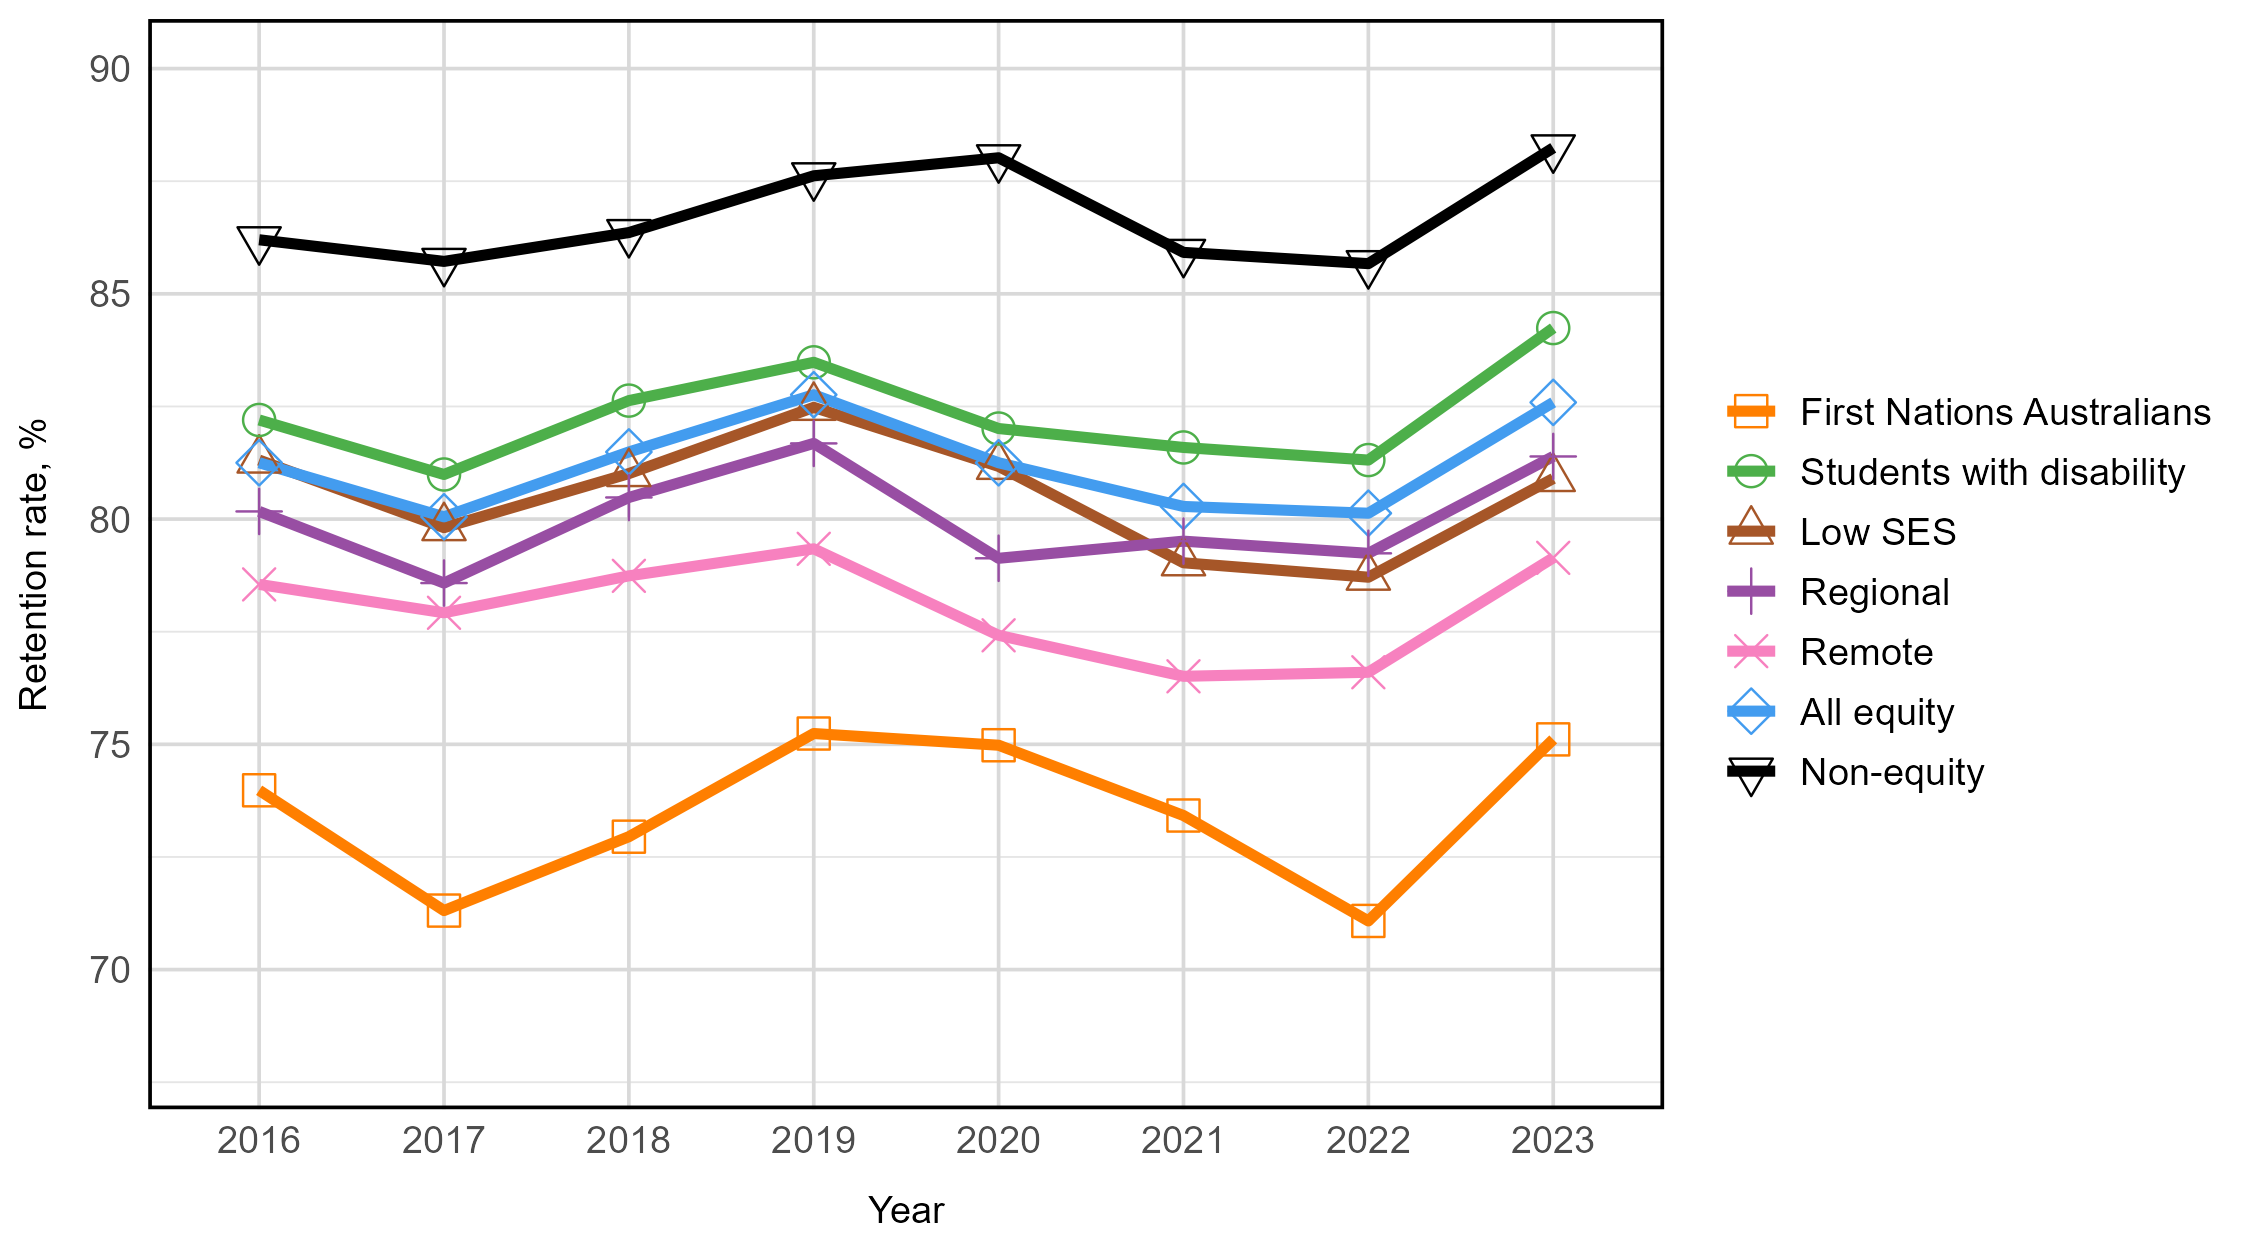
However, on a group-by-group basis, the retention rate ranged from 75% for First Nations Australian students to 84% for students with disability—compared with 88% for “non-equity” students.

The retention rate of domestic undergraduate students between 2016 and 2023 enrolled at Table A institutions, split by equity group. Year is plotted on the x-axis and retention rate is plotted on the y-axis. All lines are between 70% and 90%. The chart shows all groups having an increased retention rate in 2019, compared to 2016, which then decreases to 2016 levels in 2022, before increasing in 2023. The chart shows that non-equity students had the highest retention rate across all years, at approximately 87%. First Nations Australians had the lowest retention rate over all years, ranging from 71% in 2017 to 75% in 2019 and 2020. The second lowest retention rate was for students from remote areas. All other groups were reasonably similar, with retention rates of approximately 78% to 83%.

Report author and ACSES Data Program Director, Associate Professor Gemma Cadby, said closer examination of the data revealed even greater variation.

“For example, while the overall retention rate for students from remote areas was nearly 80%, the retention rate at individual institutions for this equity group ranged from 46% to 100%,” she said.

Dot plot showing retention rate of domestic undergraduate students in 2023, split by equity group. Each dot represents a Table A institution, and the black horizontal line represents the overall retention rate across all institutions for each equity group. All groupings show considerable spread in retention. The largest spread is for students from remote areas, with retention ranging from 46% to 100%. First Nations Australian students have the next largest spread, ranging from 54% to 97% retention.

Higher education retention data reflects the effectiveness of universities in supporting underserved student cohorts—or equity groups—who have been historically disadvantaged in the education system.

It is a key indicator of student success and institutional performance, serving as a critical measure of engagement among equity groups.

“Retention rate data is important for identifying where retention challenges are concentrated and informing more targeted and effective institutional and sector‑level initiatives,” Associate Professor Cadby said.

“But it’s only a starting point. With access to more detailed data held by universities, it would be possible to undertake an even deeper analysis—for example, stratifying retention by mode of attendance (online versus in‑person), mode of study (full‑time versus part‑time), field of education or course, support service usage, and much more.”

The full report, Retention rates in Australian higher education: Analysis of 2024 data (2026 update), is now available on the ACSES website.

To further explore these data, along with additional indicators, refer to ACSES’s Interactive Data Tool.