You are using an
outdated
browser. Please
upgrade your browser
to improve your experience and security.
The Australian Centre for Student Equity and Success acknowledges Indigenous peoples across Australia as the Traditional Owners of the lands on which the nation’s campuses are situated. With a history spanning more than 60,000 years as the original educators, Indigenous peoples hold a unique place in our nation. We recognise the importance of their knowledge and culture, and reflect the principles of participation, equity, and cultural respect in our work. We pay our respects to Elders past, present, and future, and consider it an honour to learn from our Indigenous colleagues, partners, and friends.
Aboriginal and/or Torres Strait IslanderDisabilityLow socioeconomic statusRegional, rural and remoteResourcesData Insight Series
Author
ACSES
Published on
March 23, 2026
Read time
Acknowledgements
This report was prepared by the Data Program of the Australian Centre for Student Equity and Success (ACSES) at Curtin University.
The authors would like to acknowledge the staff at ACSES for their comments and assistance in the production of this publication and extend thanks to the Australian Government Department of Education for the provision of student equity data.
The report may be cited as: ACSES Data Program. (2026). Retention rates in Australian higher education: Analysis of 2024 data (2026 update). Australian Centre for Student Equity and Success (ACSES), Perth: Curtin University.
This report focuses on retention rates among domestic undergraduate students over the past seven years, with a focus on the 2023/2024 period. For further information on retention, participation, success, six- and nine-year cohort completion, please see the ACSES Student Equity Data Interactive Tool.
Copyright ownership of this material resides with Curtin University.
ISBN – 978-0-6454877-2-5
The ACSES Data Insights Series
The Australian Centre for Student Equity and Success (ACSES) is an evidence-based research and public policy centre based at Curtin University and funded by the Australian Government Department of Education. ACSES is committed to providing the higher education sector with tangible proof of what works to improve the quality and impact of student equity practices in higher education.
The ACSES Data Insights Series reports on equity student participation and outcomes in Australian higher education. It focuses on trends among identified equity groups[1] in domestic undergraduate enrolments in Australia, including, but not limited to:
low socio-economic status (“low SES”) students
students with disability
First Nations (Aboriginal and Torres Strait Islander) Australian students
regional students
remote students.
How to access the full report
The report is displayed here in full text and is also available for download in Word [3 MB] and PDF [4 MB] format.
Data explanatory notes
All student data reported in this document are sourced from a customised request to the Australian Government Department of Education[2].
For this report:
Analysis was restricted to domestic, onshore, undergraduate students from Table A institutions (Higher Education Support Act 2003).
The retention rate is calculated for commencing students.
The retention rate used is the Sector Retention Rate (New Adjusted Retention Rate)[3], which counts students who switch institutions in the previous year as being retained within the higher education system.
Retention rate is a lagging indicator. This means data labelled “2023” refers to students from 2023 who returned to higher education in 2024.
The identification of students from low SES, regional, and remote backgrounds is based on their first address.
“Non-equity students” refers to students who do not belong to any of the key equity groups presented in this report, namely, students with disability, First Nations Australian students, and students from low SES, regional, and remote areas.
If the commencing student count was fewer than five for any university and equity grouping, retention has been excluded. This has resulted in one university and equity group (Victoria University and students from remote areas) being excluded from this report.
Readers should know the Department of Education released the following note about the 2020 equity data collection:
A note about 2020 Higher Education Equity and Equity Performance Data During the transition to the Tertiary Collection of Student Information (TCSI) System, enrolment numbers for students with disability were substantially under-reported in the case of several universities. This issue affects data in Section 11, Section 16 and some Visual Analytics products. Caution should be taken when using the 2020 enrolment data points for students with disability. All other time points are unaffected. (Australian Government Department of Education, 2025).
This caveat applies to data sourced via the Department’s official site and customised requests. For this reason, caution should be exercised in reporting and analysing data on disability from 2020.
Retention rates in Australian higher education
Student retention rates are a key indicator of both student success and institutional performance within Australian higher education. They also serve as a critical measure of equity student engagement in higher education, reflecting the effectiveness of institutions in supporting underserved student cohorts. Low retention rates (and corresponding high attrition rates) are a concern for students because of unsatisfactory learning outcomes and accumulated tuition debt, and for higher education providers and government in terms of reduced productivity and financial inefficiencies[4].
Ensuring the retention and success of students from equity backgrounds is critical to sustaining success and participation in higher education. Historically, these groups have exhibited lower retention rates compared to their peers, a disparity often attributed to factors like increased employment commitments during study, heightened financial stress, and a greater prevalence of part-time enrolment[5],[6],[7],[8].
Until December 2025, the Australian Government Department of Education administered the Higher Education Participation and Partnerships Program (HEPPP), which allocated funding to Table A universities. This initiative aimed to increase the retention of students from regional and remote Australia, low SES backgrounds, and First Nations Australian communities. HEPPP funding enabled institutions to develop and implement student support programs designed to increase retention rates, and in turn, improve degree completion outcomes.
In January 2026, the Australian Government introduced demand-driven Needs-based Funding (NBF). NBF provides per-student funding contributions for First Nations Australian students, students with disability, and low SES students, along with students studying at regional campuses.
Importance of comparative data
Comparisons between higher education institutions are an important tool for understanding and benchmarking institutional equity performance and identifying areas for improvement. For instance, an institution with a student retention rate of 80% might want to see how this compares to other institutions to gauge its relative performance. While such comparisons are valuable, they require careful consideration due to a range of factors that can complicate meaningful analysis, including geographical, institutional, and operational differences. For further information, please see Student Equity Data Guide: Challenges in Comparing Student Outcomes Across Higher Education Institutions.
Retention rates over the past eight years
Overall retention has increased between 2016 and 2023
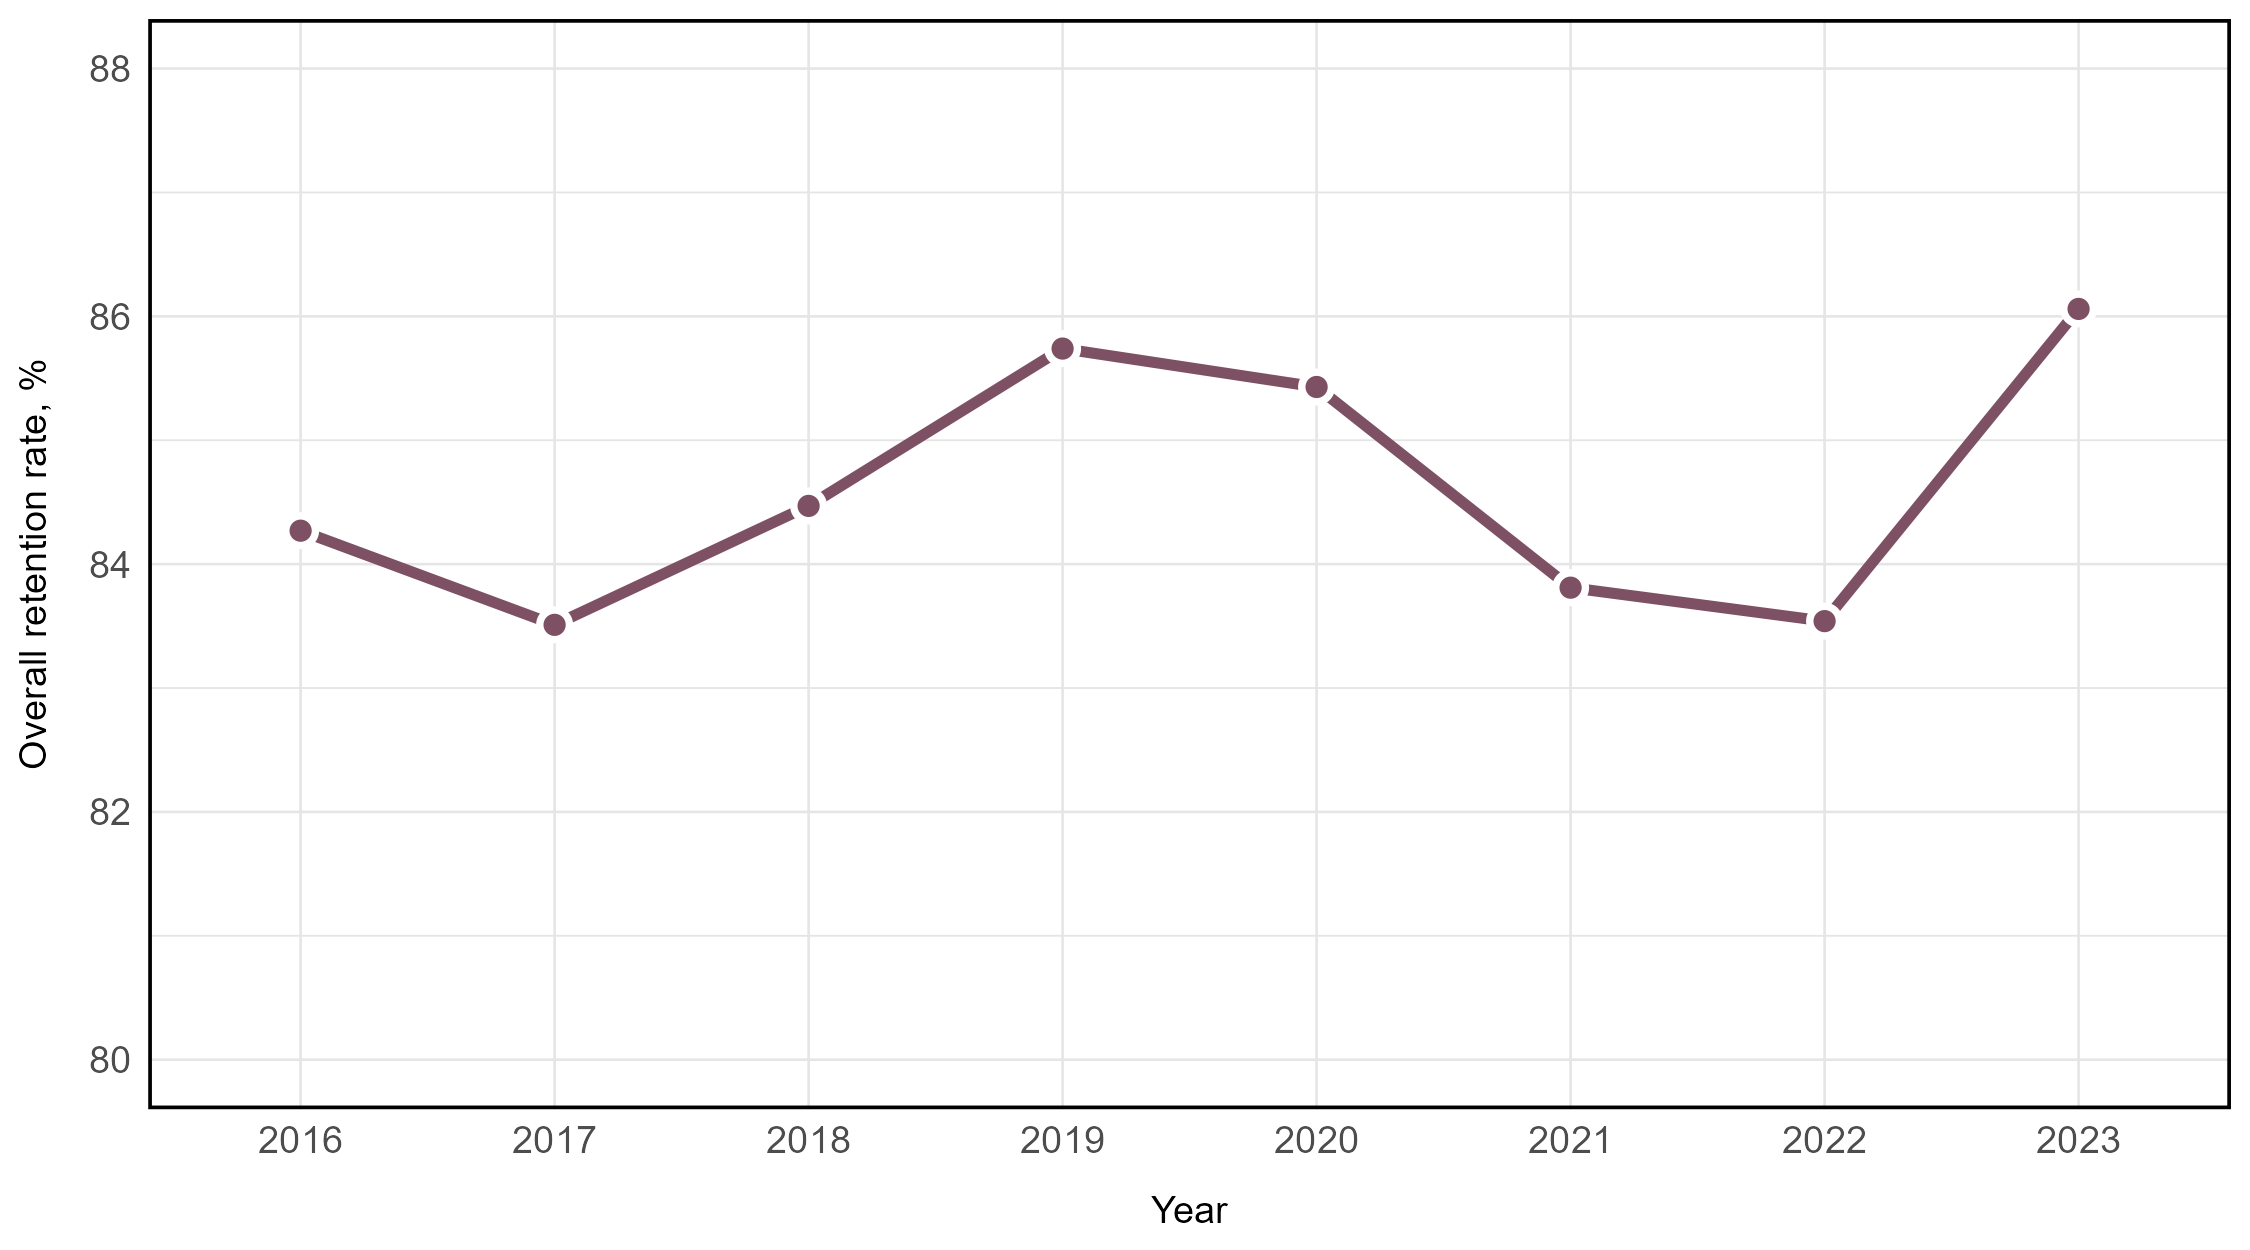
Over the past eight years, the retention rate of domestic undergraduate students has increased by 1.8%. The retention rate across all Table A institutions was 84.3% in 2016, increasing to 85.7% in 2019, decreasing to 83.5% in 2022, and increasing to 86.1% in 2023.
Figure 1: Retention rate of domestic undergraduate students between 2016 and 2023 enrolled at Table A institutions
There are significant differences in retention rates between equity student groups
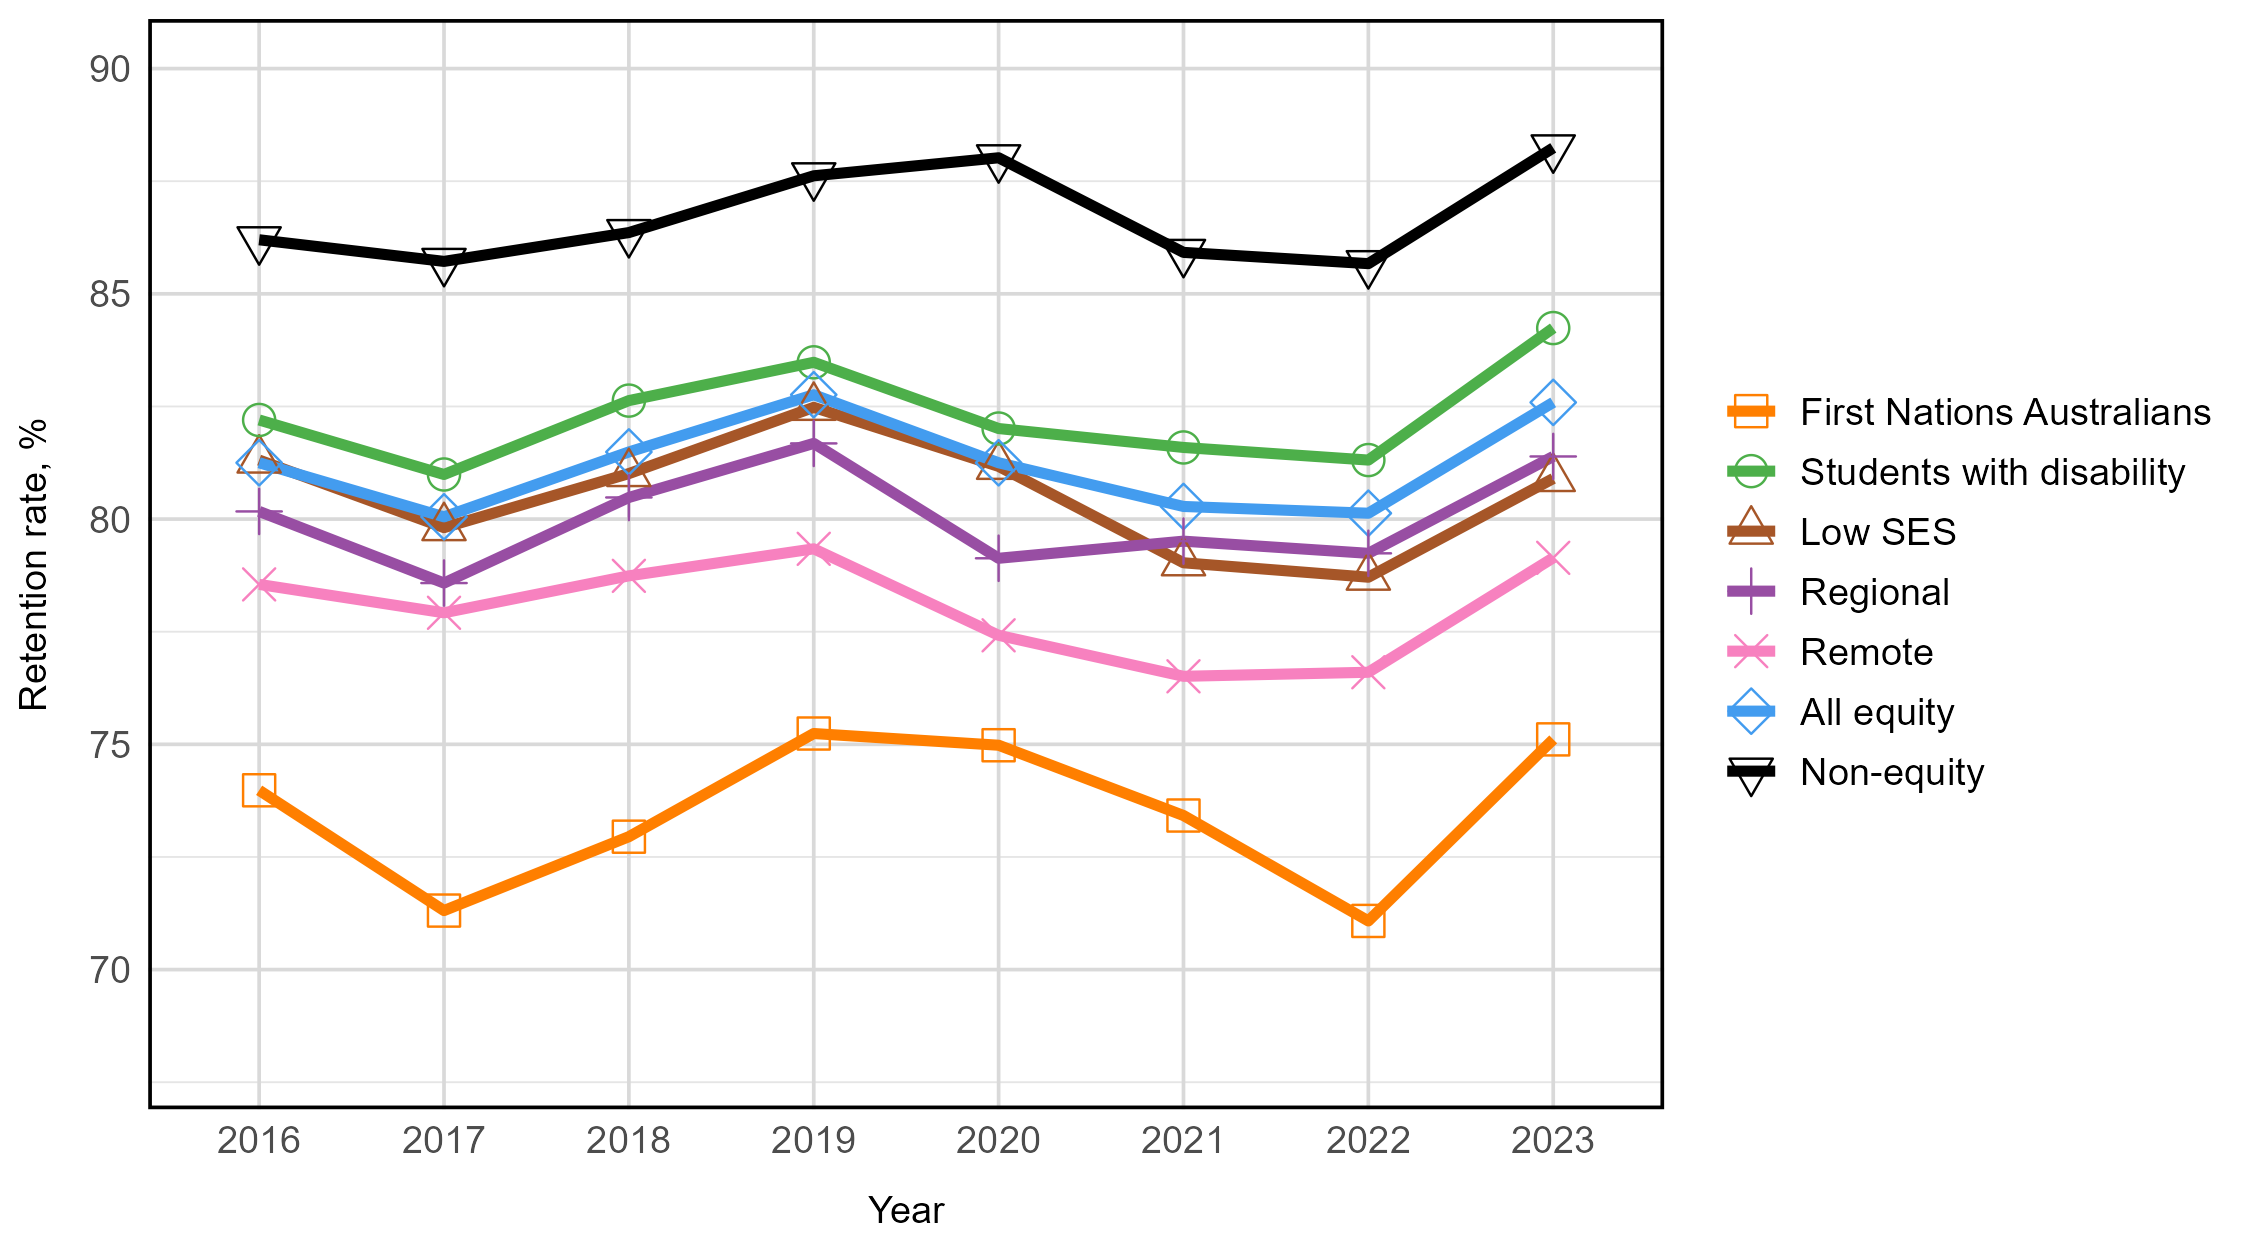
Between 2016 and 2023, non-equity students consistently had higher retention rates than each of the equity groups. All student groups, apart from students from low SES areas, had higher retention rates in 2023, compared to 2016. Students from low SES areas had a decline in retention of 0.4 percentage points (81.3% in 2016 and 80.9% in 2023). First Nations Australian students had the lowest retention rate across all years.
Figure 2: Retention rate of domestic undergraduate students between 2016 and 2023 enrolled at Table A institutions, split by equity group.
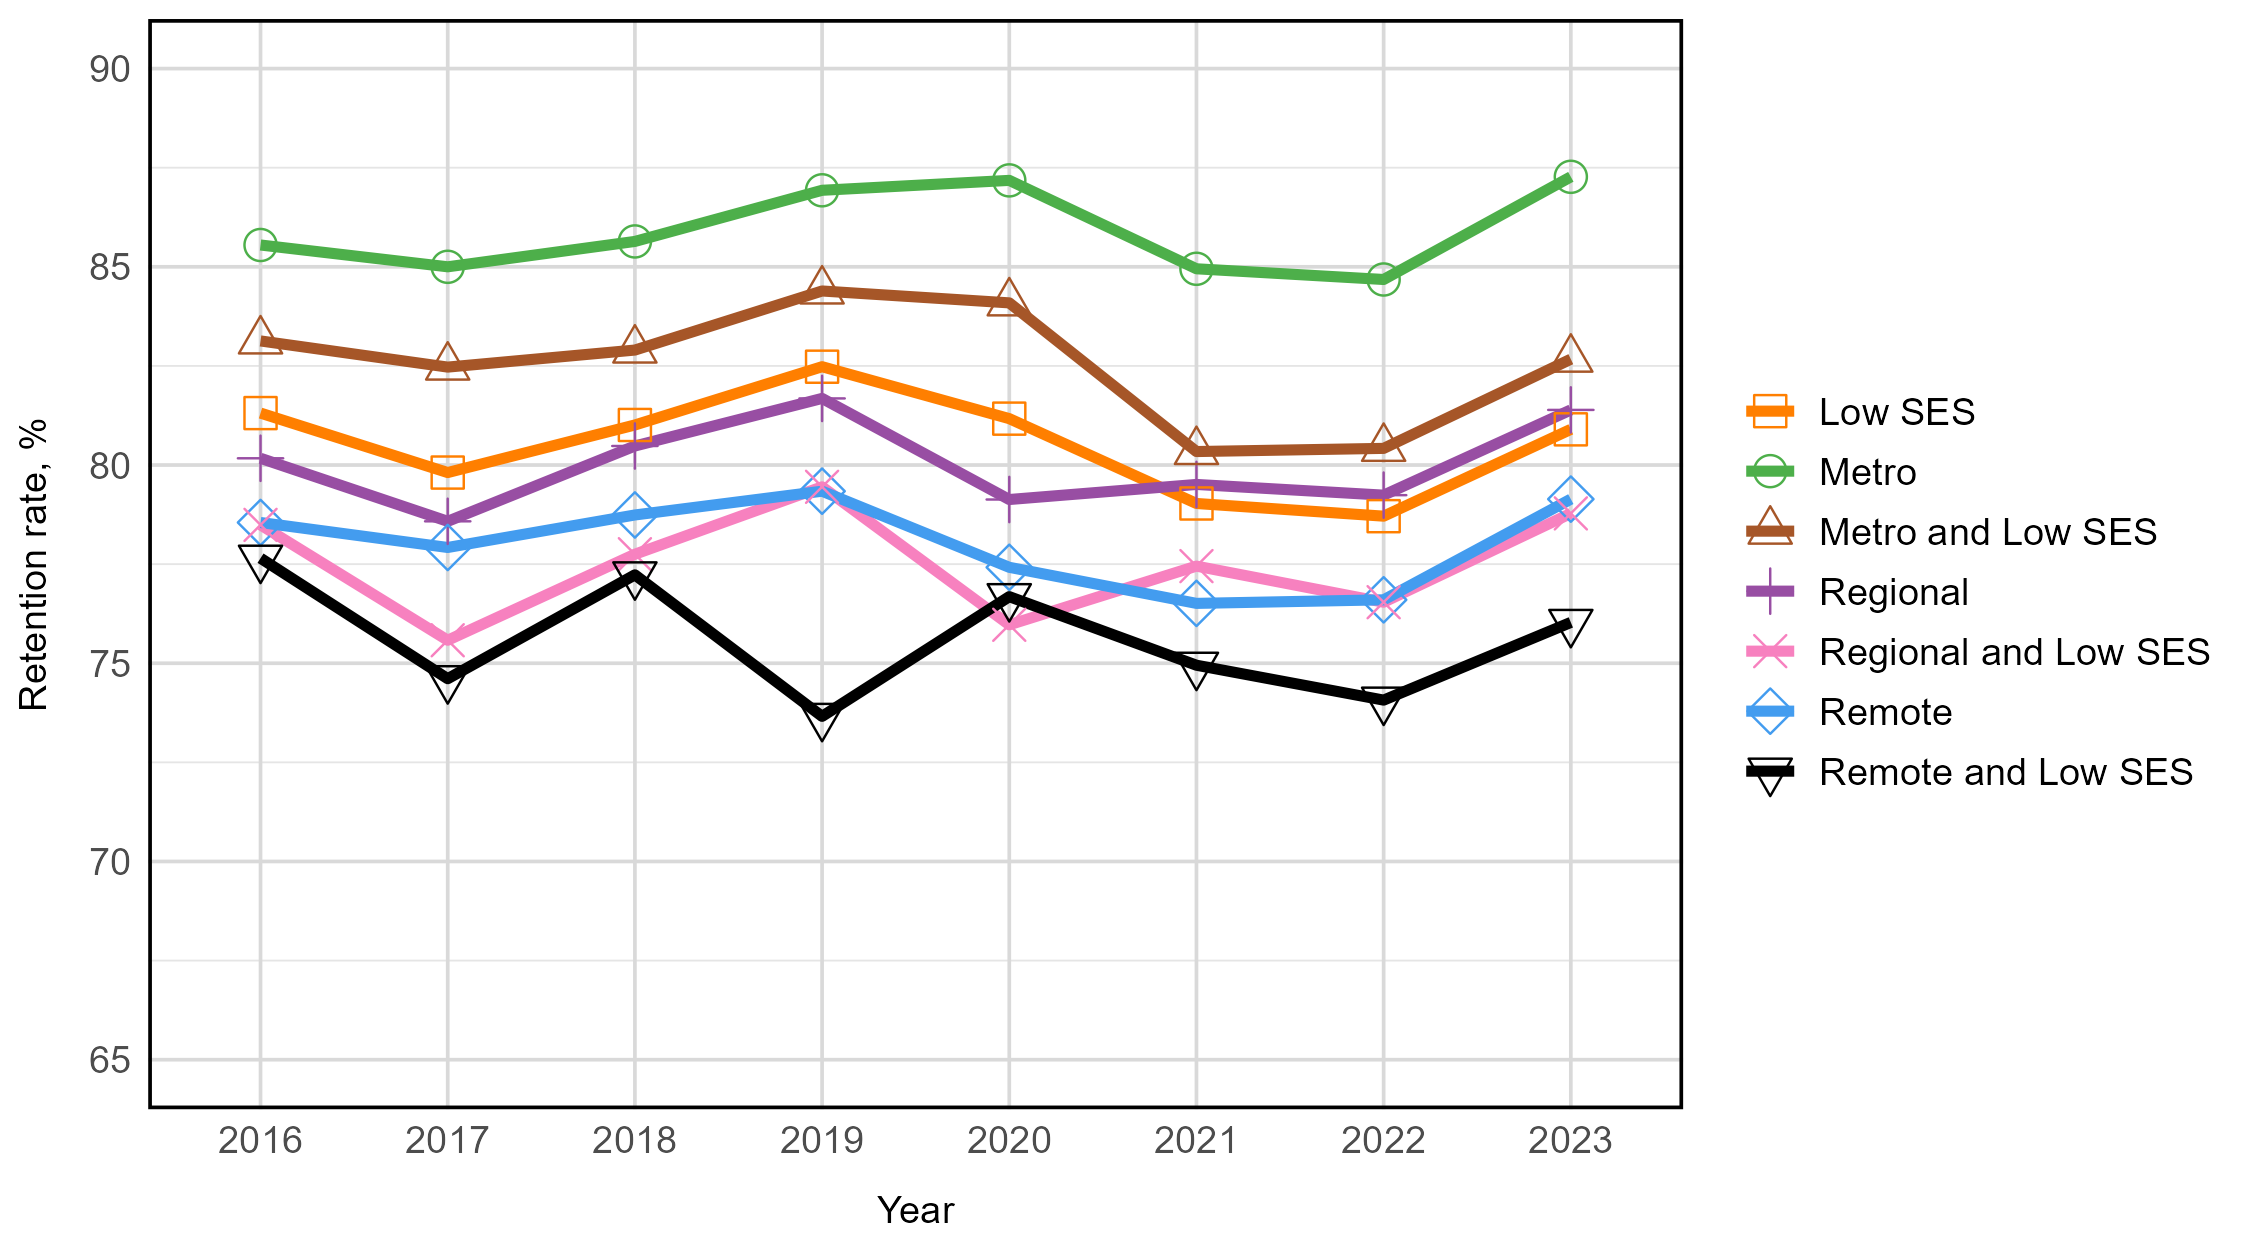
Students from remote and low SES areas had consistently lower retention rates
Figure 3: Retention rate of domestic undergraduate students between 2016 and 2023 enrolled at Table A institutions, split by multiple equity group membership.
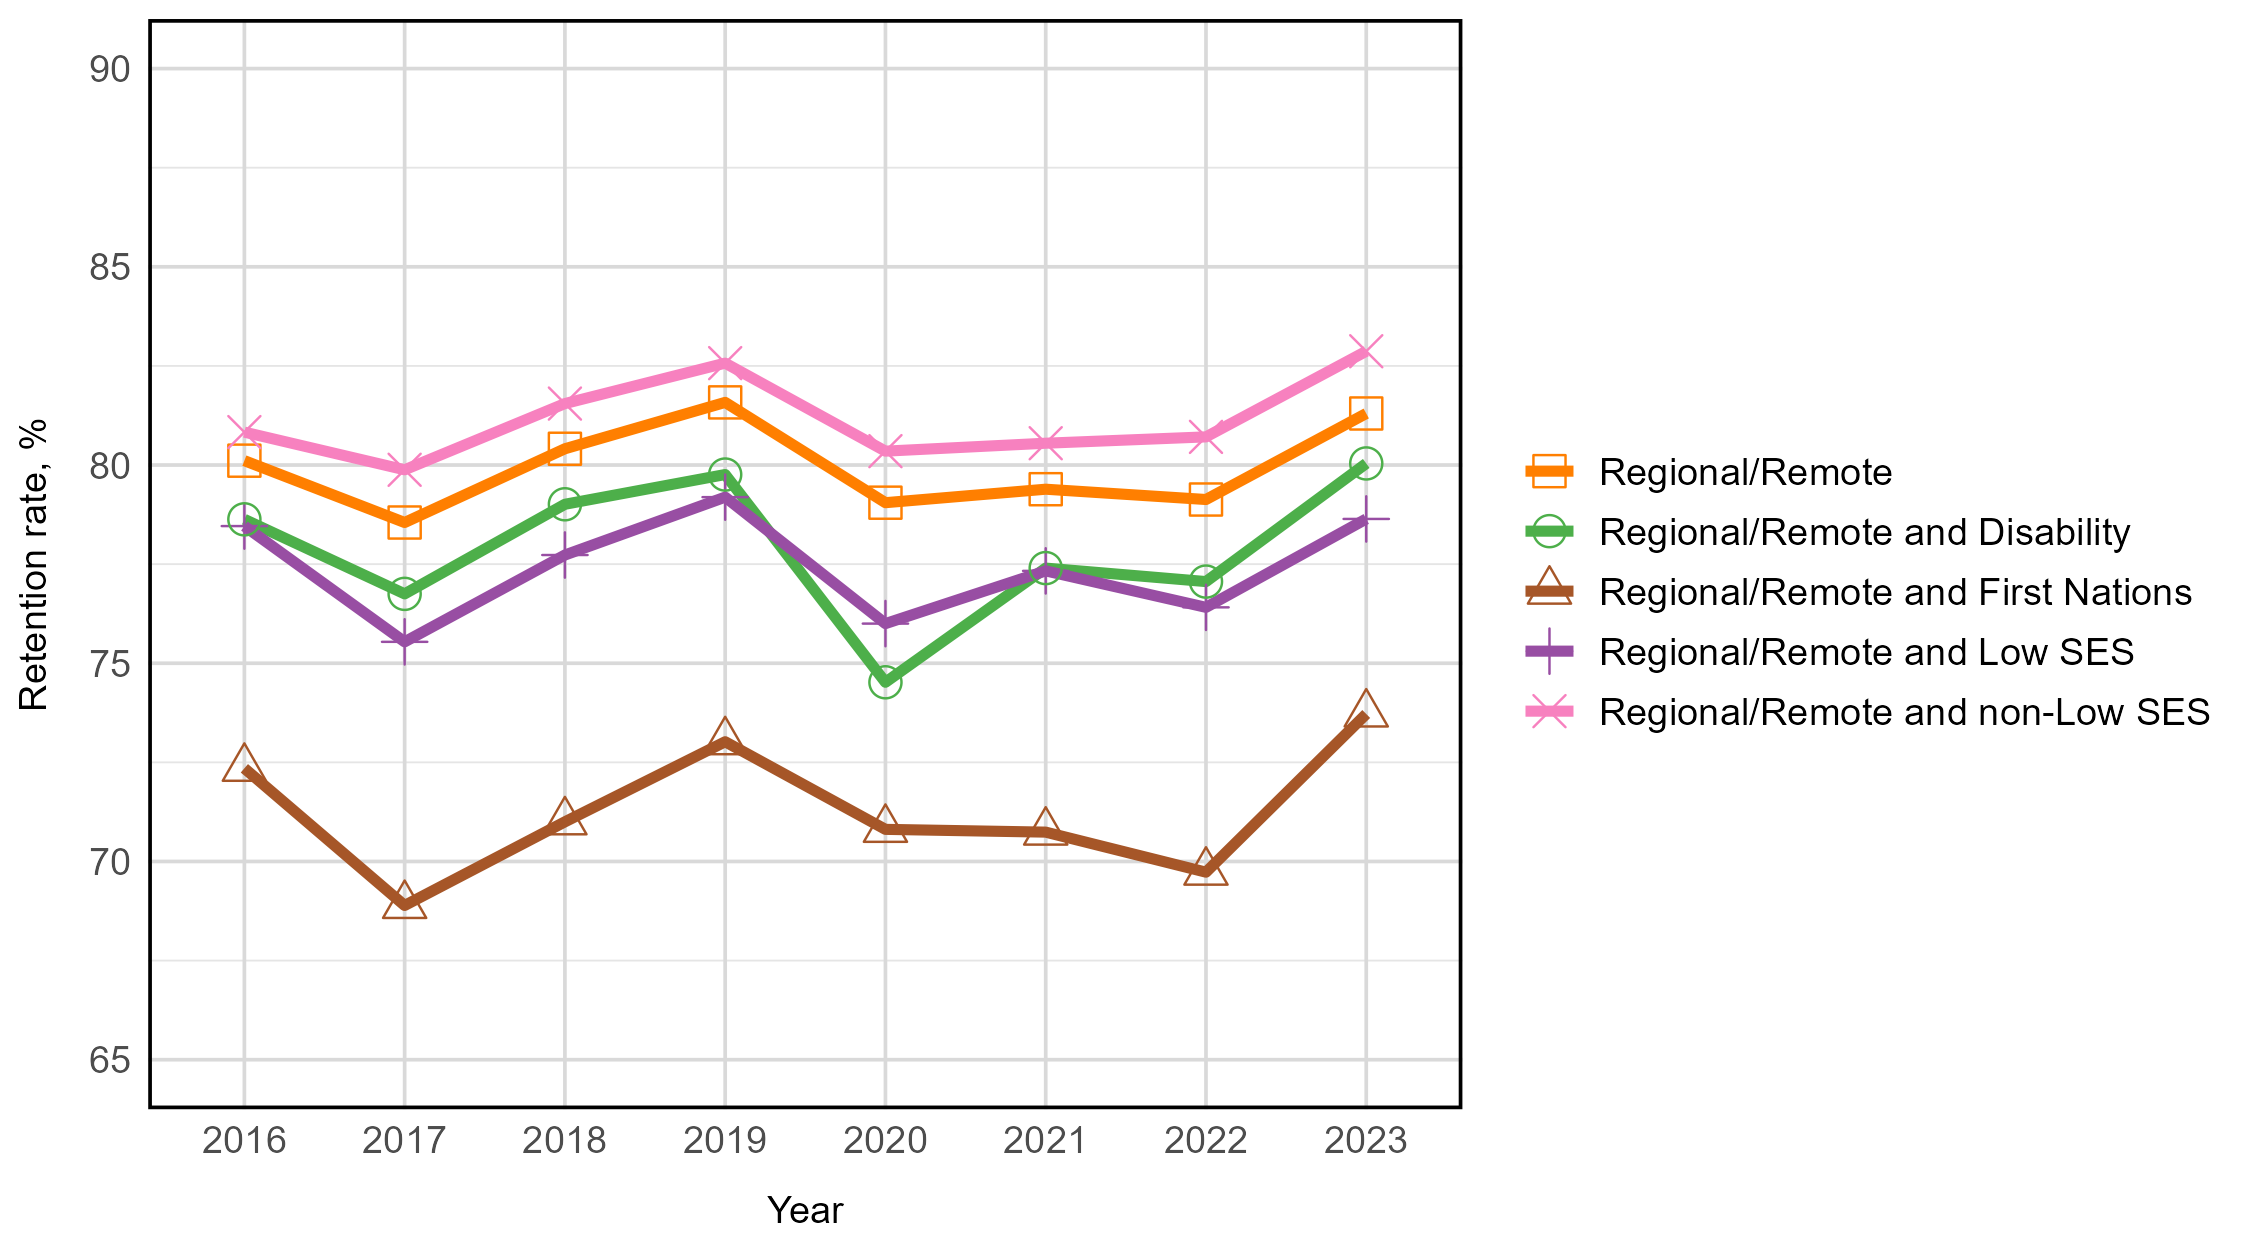
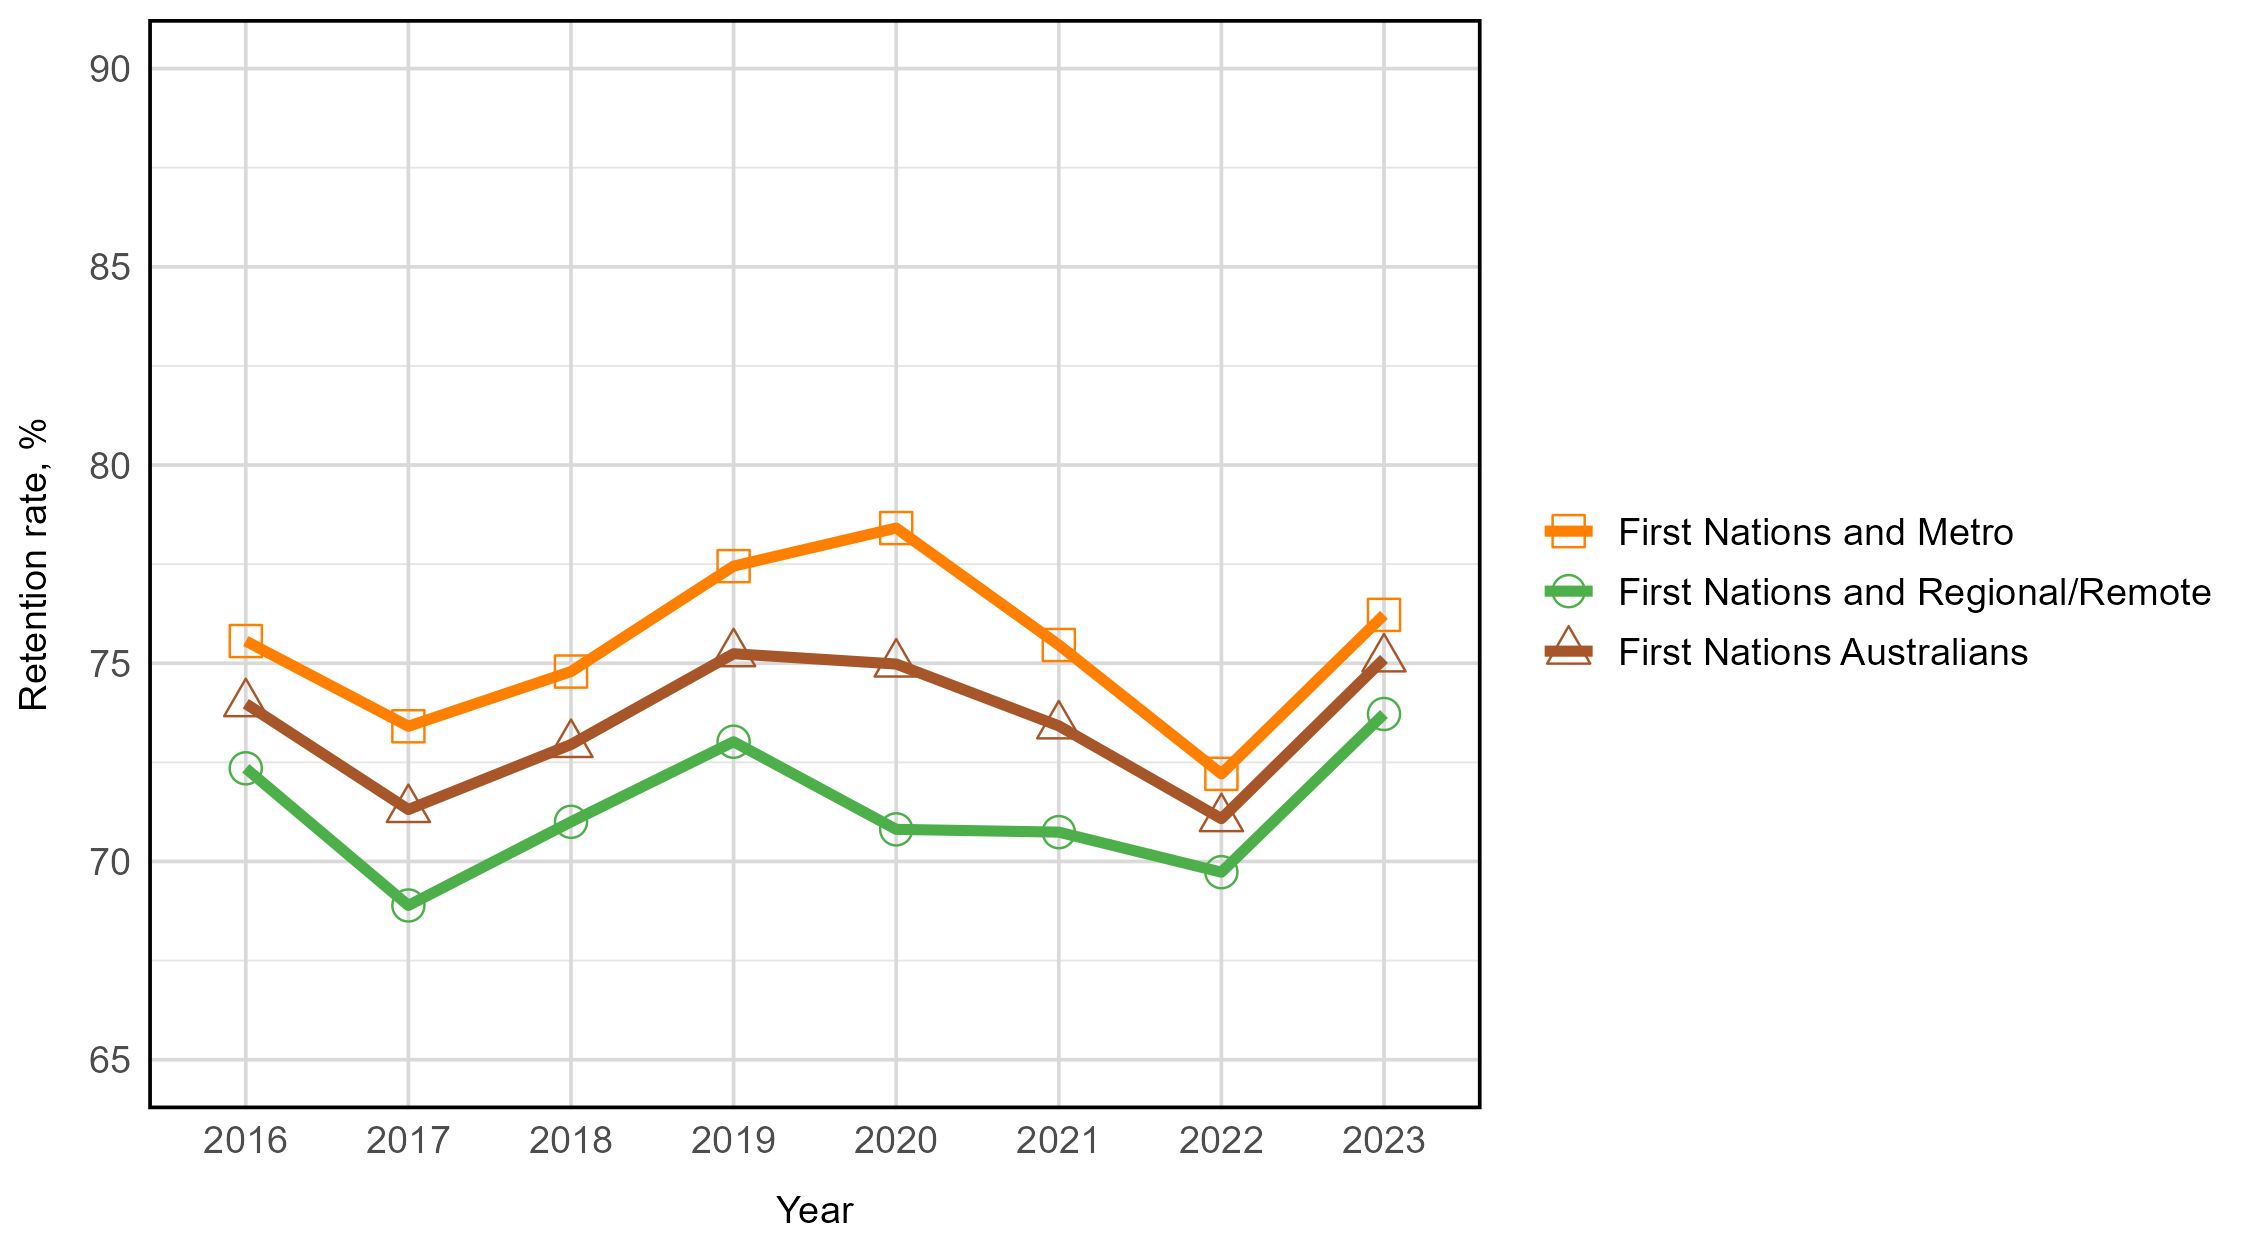
First Nations Australian students from regional and remote areas had much lower retention rates than other regional and remote groupings
Figure 4: Retention rate of domestic undergraduate students between 2016 and 2023 enrolled at Table A institutions, split by multiple equity group membership.
First Nations Australian students from metropolitan areas had higher retention rates than First Nations Australians from regional and remote areas
Figure 5: Retention rate of domestic undergraduate students between 2016 and 2023 enrolled at Table A institutions, split by multiple equity group membership.
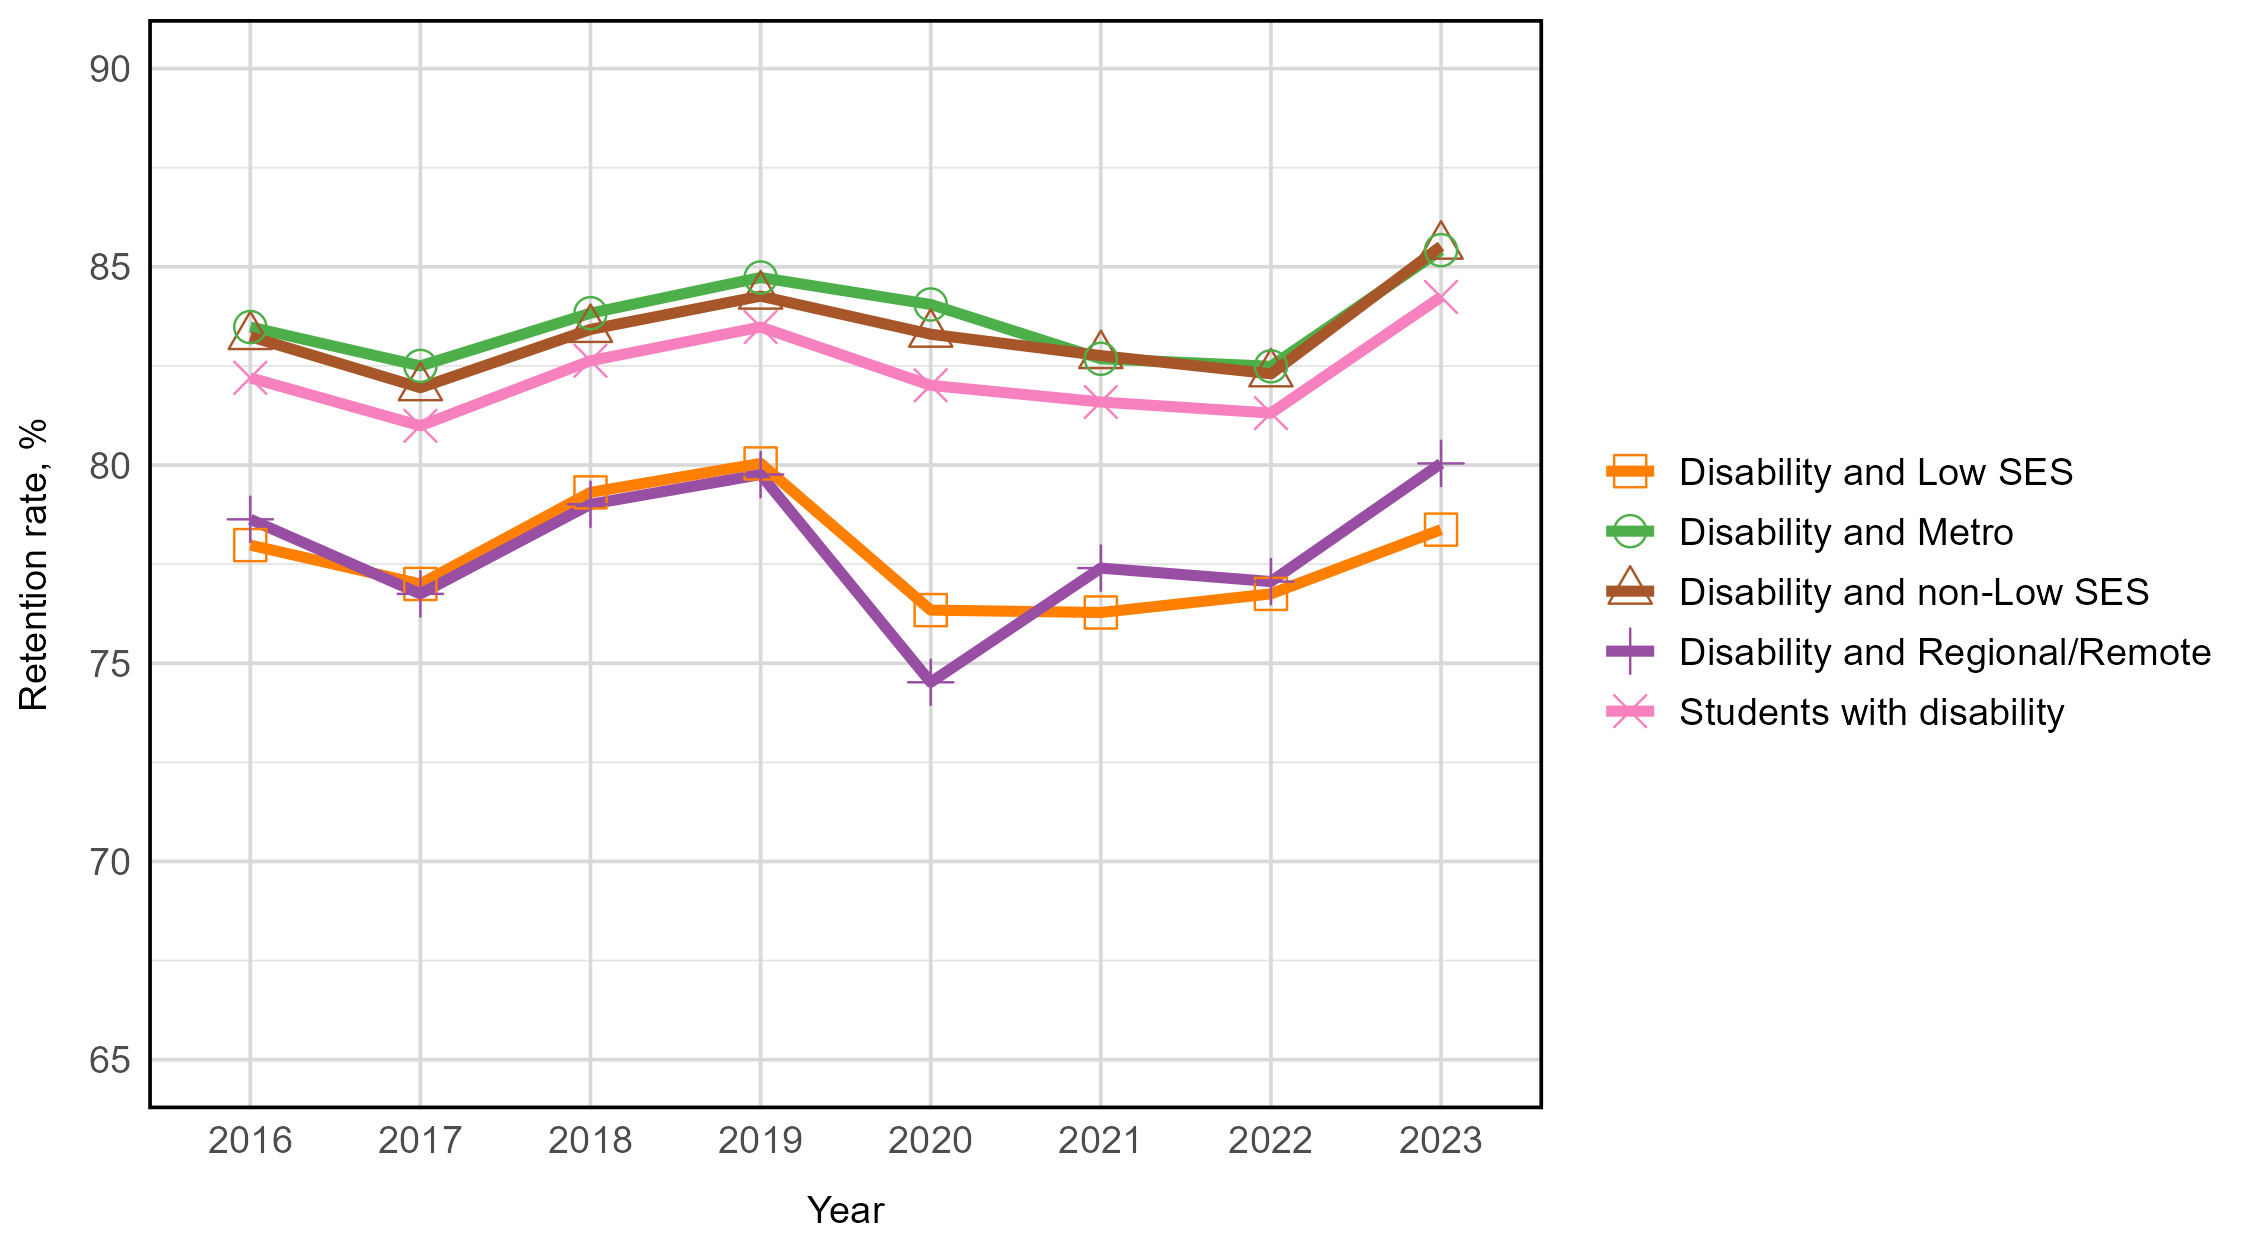
Students with disability from regional and remote areas had similar retention rates to students with disability from low SES areas
Figure 6: Retention rate of domestic undergraduate students between 2016 and 2023 enrolled at Table A institutions, split by multiple equity group membership.
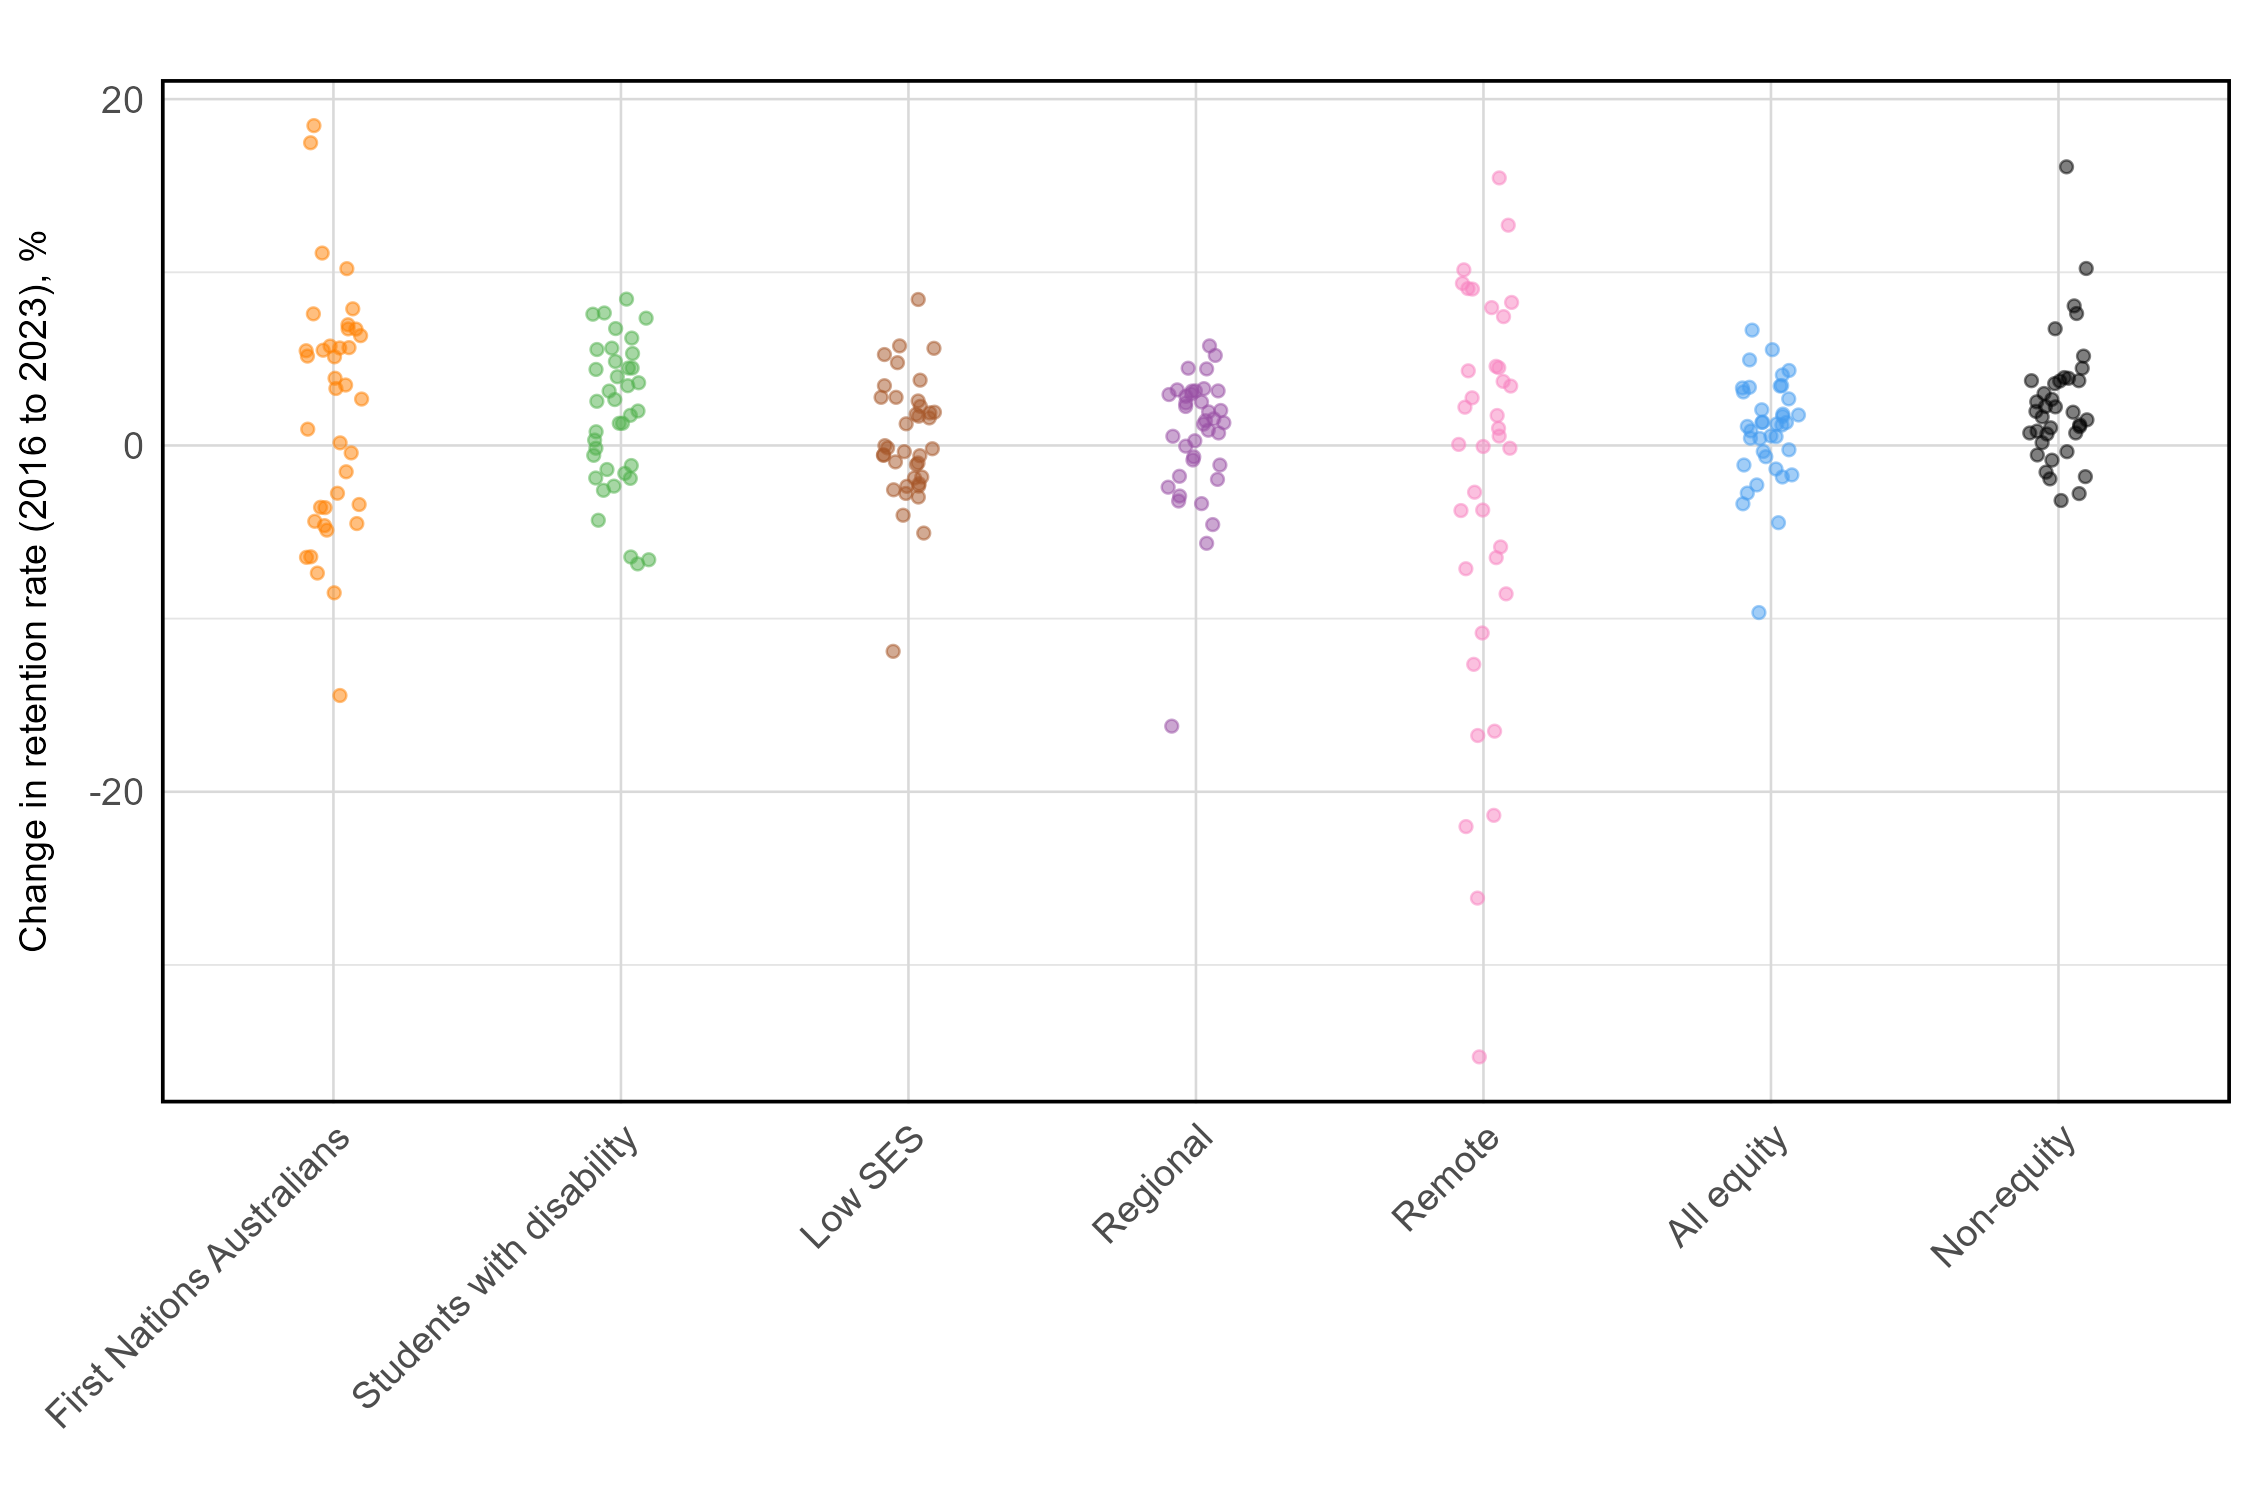
There is substantial variation in changes in retention rates over the past eight years across institutions
Institutional retention rates from 2016 to 2023 showed substantial institutional variation within each student equity group (Figure 7). This is most pronounced for students from remote areas: three institutions increased retention by more than 10 percentage points, while nine institutions saw decreases greater than 10 percentage points, including one with a 35 percentage point drop. In Figure 7, positive values indicate an increase from 2016 to 2023, so a data point of five reflects a five percentage point increase from 2016 to 2023.
Figure 7: Change in retention rate of domestic undergraduate students between 2016 and 2023 enrolled at Table A institutions, split by equity group. Each dot represents a Table A institution. A negative value indicates a decrease in retention from 2016 to 2023, and a positive value indicates an increase in retention from 2016 to 2023.
Retention rates in 2023 (students returning in 2024)
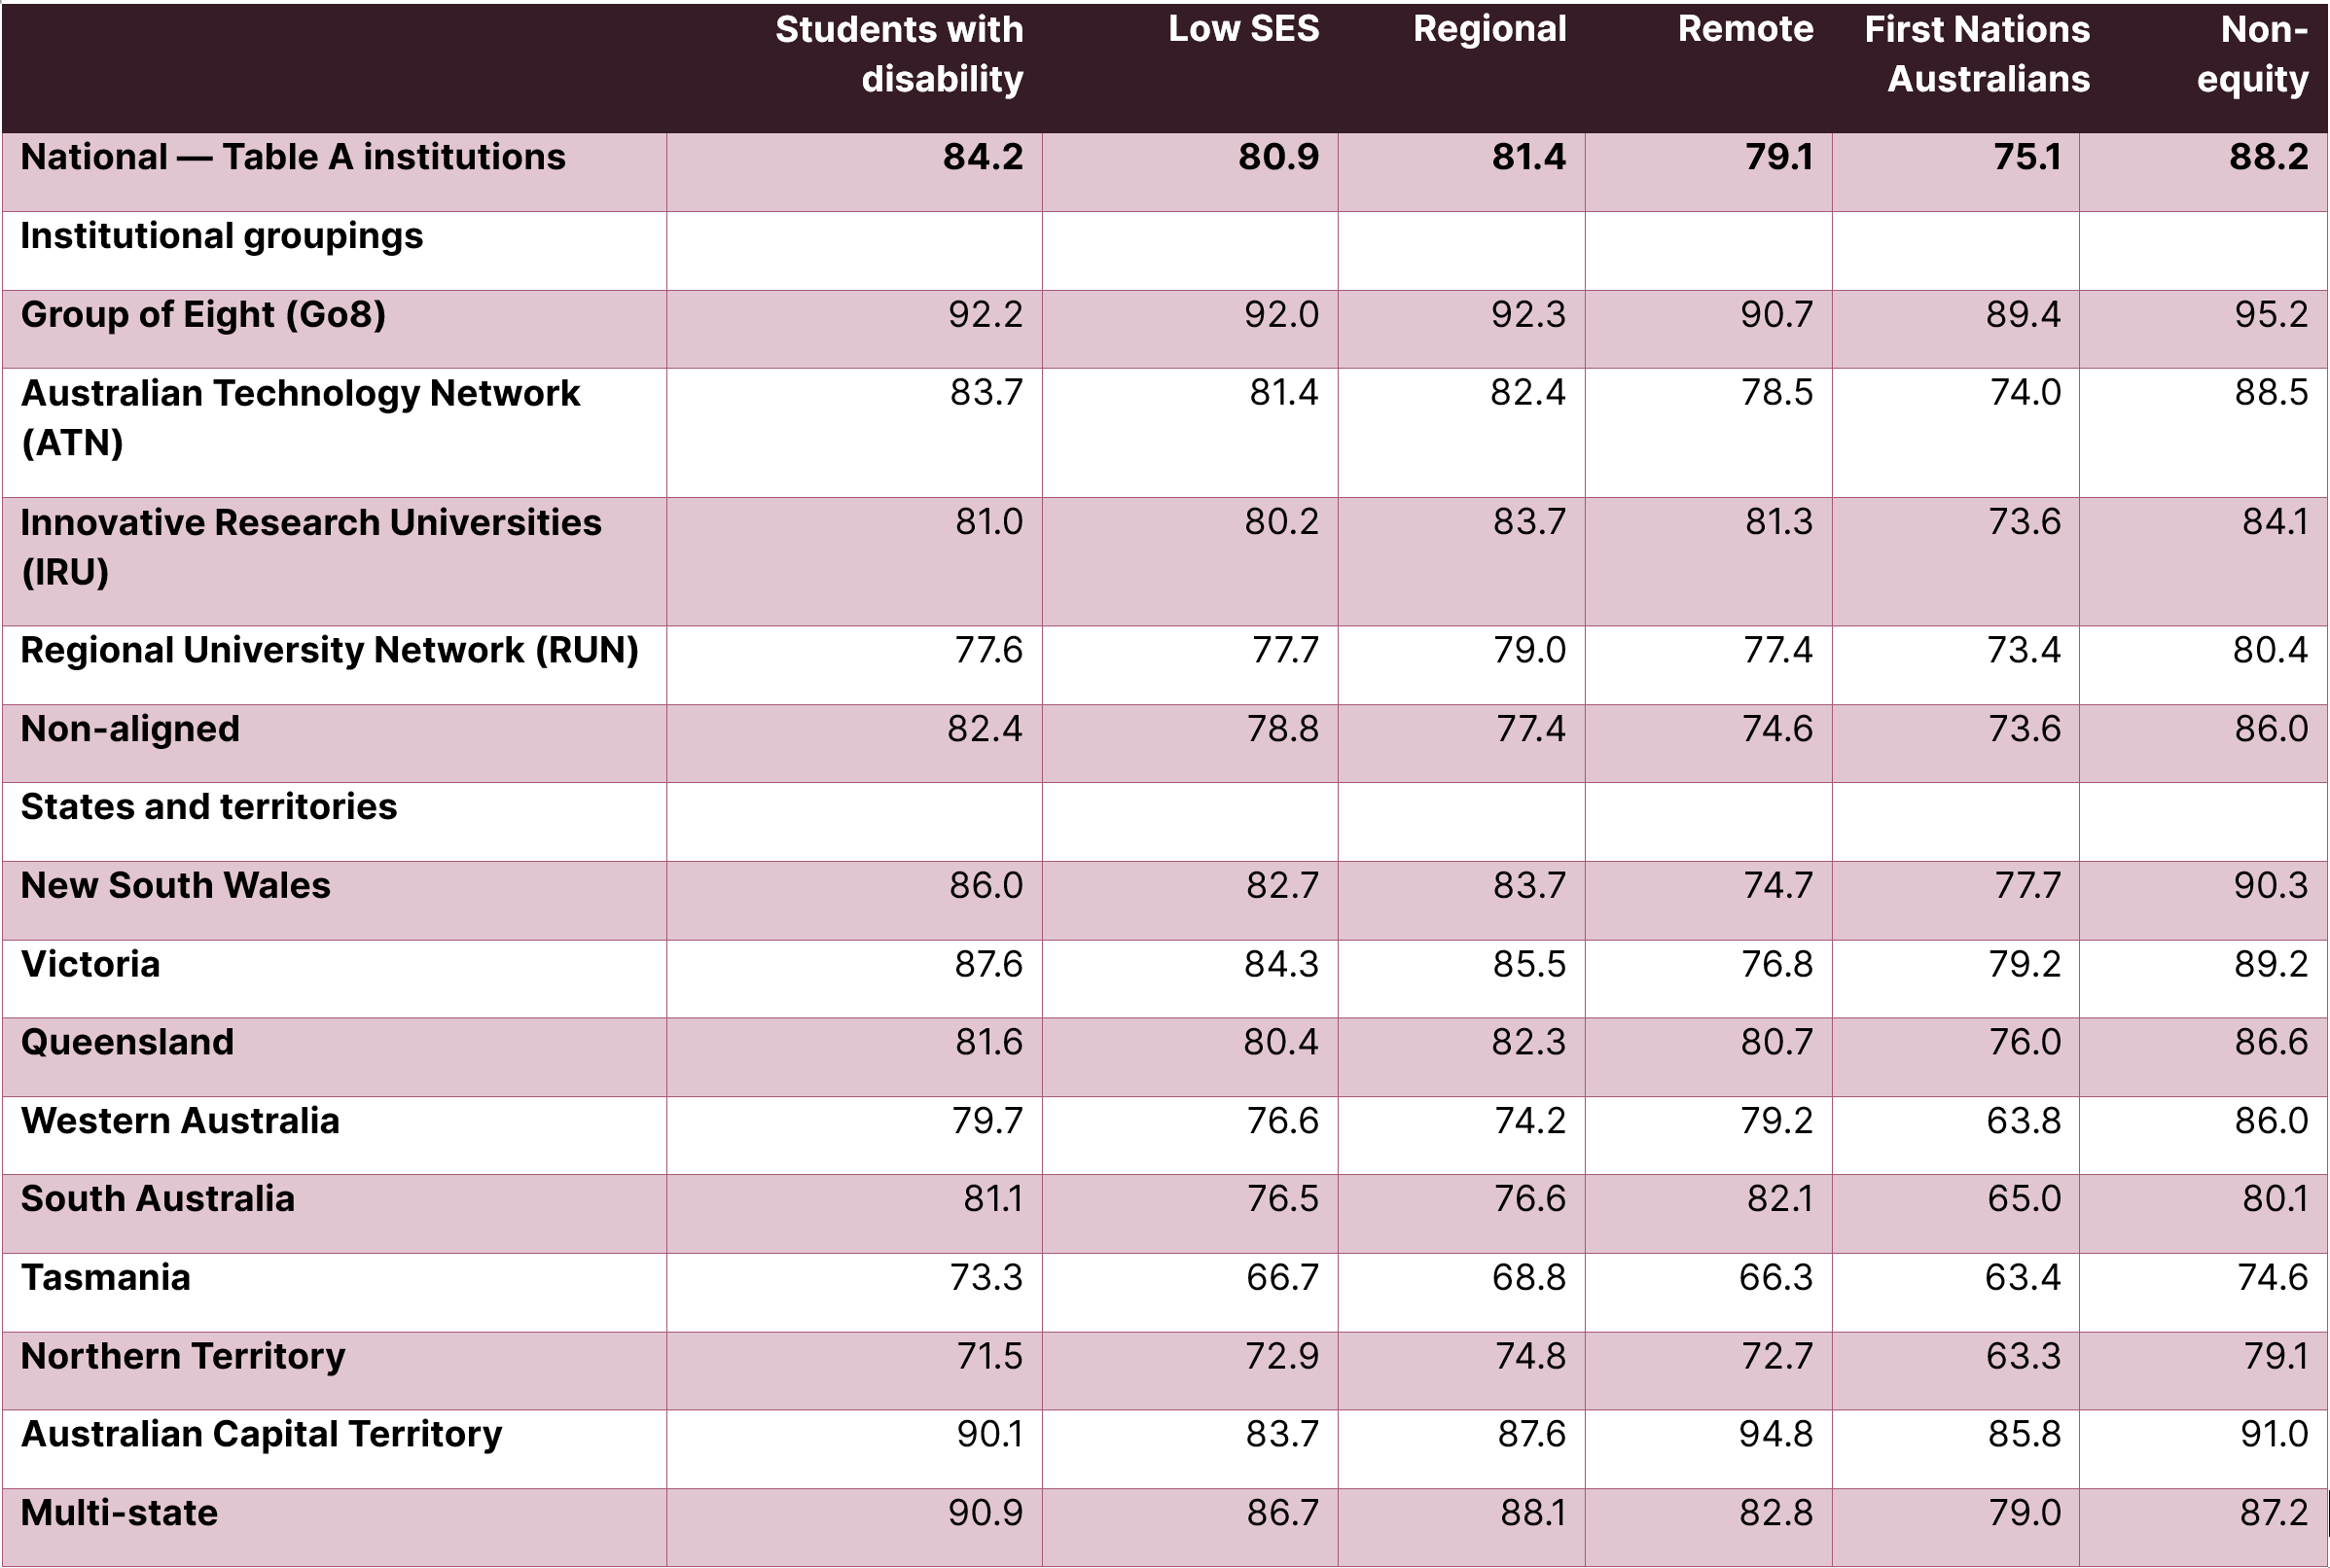
Retention rates vary across institutional groupings and states and territories
Table 1: Retention rates (%) for equity groups, by Institutional Groupings and State and Territory, Table A Institutions, 2023.
Across all Table A institutions, retention was highest for non-equity students. Among institutional groupings, Go8 universities had the highest average retention rate across all student groups. There were noticeable differences between the states and territories in terms of retention rates. The Australian Catholic University (the only multi-state university) had the highest retention rates for students with disability, students from low SES areas, and students from regional areas. The Australian Capital Territory had the highest retention rates for students from remote areas, First Nations Australian students, and non-equity students.
Sector-wide 2023 retention rates mask substantial variation across institutions
Figure 8 shows there was substantial variation in the retention rate of student groups across all institutions in 2023. The largest variation across institutions was for students from remote areas, with estimates ranging from 46.3% to 100%. All other student equity groups showed a large variation across institutions.
Figure 8: Retention rate of domestic undergraduate students in 2023, split by equity group. Each dot represents a Table A institution, and the black horizontal line represents the overall retention rate across all institutions for each equity group.
Within-institution retention rates
To identify differences in retention between equity student groups and non-equity student groups within each institution, their retention rates can be compared (Figures 9 to 13). In Figure 9, the vertical (y-) axis represents the retention rate for students with disability, while the horizontal (x-) axis represents the retention rate for students without disability at the same institution. If retention rates are identical for both groups within an institution, its data point will lie on the 45-degree line. If retention rates at an institution are higher for students with disability compared to students without disability, the dot will be above the 45-degree line, and if retention rates are lower for students with disability compared to students without disability, the dot will be below the 45-degree line.
Retention rates for students with disability were lower than retention rates for students without disability, except for four institutions
Figure 9: Relationship between the retention rate of students who did not report a disability and students with disability. Each dot represents a Table A institution. The dotted line represents x=y, where institutions falling on this line have the same retention rate in both student groups. Institutions falling above the dotted line have higher retention rates for students with disability, compared to students not reporting a disability.
Retention rates for First Nation Australian students were substantially lower than non-First Nation Australian students, except for two institutions
Figure 10: Relationship between the retention rate of students who do not identify as First Nations Australians, and First Nations Australian students. Each dot represents a Table A institution. The dotted line represents x=y, where institutions falling on this line have the same retention rate in both student groups. Institutions falling above the dotted line have higher retention rates for First Nations Australian students, compared to students who are not First Nations Australians.
Retention rates for students from low SES areas were lower than students from high SES areas, except for in two institutions
Figure 11: Relationship between the retention rate of students from high SES areas and low SES areas. Each dot represents a Table A institution. The dotted line represents x=y, where institutions falling on this line have the same retention rate in both student groups. Institutions falling above the dotted line have higher retention rates for students from low SES areas, compared to students from high SES areas.
Retention rates for students from regional areas were slightly lower compared to students from metropolitan areas
Figure 12: Relationship between the retention rate of students from metropolitan areas and regional areas. Each dot represents a Table A institution. The dotted line represents x=y, where institutions falling on this line have the same retention rate in both student groups. Institutions falling above the dotted line have higher retention rates for students from regional areas, compared to students from metropolitan areas.
Retention rates for students from remote areas were slightly lower compared to students from metropolitan areas
Figure 13: Relationship between the retention rate of students from metropolitan areas and remote areas. Each dot represents a Table A institution. The dotted line represents x=y, where institutions falling on this line have the same retention rate in both student groups. Institutions falling above the dotted line have higher retention rates for students from remote areas, compared to students from metropolitan areas.
Relationship between retention rate and participation share
It is important to note there are large variations in the number of students within each of these equity groups at different institutions. When examining the correlation between 2023 retention rates and 2024 participation shares (Figures 14 to 18), we observe a negative correlation for low SES, regional, remote, and First Nations Australian students. That is, institutions with a lower share of students from these equity groups tend to have higher retention rates for these groups. In contrast, we find no correlation between retention rates and participation shares for students with disability.
These findings highlight the importance of considering both retention rates and participation shares together rather than in isolation. When comparing retention rates between institutions, it is important to compare institutions with similar participation shares rather than focusing solely on retention rates. Comparing an institution with a high proportion of equity students to a highly selective institution with very few equity students may not provide meaningful insights. Instead, benchmarking retention rates against universities with similar student demographics can help identify which institutions are particularly effective at supporting equity students and where targeted interventions may be needed.
There was no relationship between the participation share of students with disability and the retention rate
Figure 14: Relationship between institutional participation share and retention rate for students with disability. Each dot represents the Table A university as labelled.
There was a negative correlation between retention rate and participation share for First Nations Australian students
Figure 15: Relationship between institutional participation share and retention rate for First Nations Australian students. Each dot represents the Table A university as labelled.
There was a strong negative correlation between retention rate and participation share for students from low SES areas
Figure 16: Relationship between institutional participation rate and retention rate for students from low SES areas. Each dot represents the Table A university as labelled.
There was a negative correlation between retention rate and participation share for students from regional areas
Figure 17: Relationship between institutional participation rate and retention rate for students from regional areas. Each dot represents the Table A university as labelled.
There was a weak negative correlation between retention rate and participation share for students from remote areas
Figure 18: Relationship between institutional participation rate and retention rate for students from remote areas. Each dot represents the Table A university as labelled.
[8] Li, IW & Carroll DR. (2019): Factors influencing dropout and academic performance: an Australian higher education equity perspective, Journal of Higher Education Policy and Management.