You are using an
outdated
browser. Please
upgrade your browser
to improve your experience and security.
The Australian Centre for Student Equity and Success acknowledges Indigenous peoples across Australia as the Traditional Owners of the lands on which the nation’s campuses are situated. With a history spanning more than 60,000 years as the original educators, Indigenous peoples hold a unique place in our nation. We recognise the importance of their knowledge and culture, and reflect the principles of participation, equity, and cultural respect in our work. We pay our respects to Elders past, present, and future, and consider it an honour to learn from our Indigenous colleagues, partners, and friends.
The Australian Centre for Student Equity and Success (ACSES) is an evidence-based research and public policy centre based at Curtin University and funded by the Australian Government Department of Education (the Department). ACSES is committed to providing the higher education sector with tangible proof of what works to improve the quality and impact of student equity practices in higher education.
The ACSES Data Insights Series reports on equity student participation and outcomes in Australian higher education. It focuses on trends among identified equity groups in domestic undergraduate enrolments in Australia, including, but not limited to:
Low socio-economic status (SES) students
Students with Disability
First Nations (Aboriginal and Torres Strait Islander) Australian students
Regional students
Remote students
How to access the full report
The report is displayed here in full text and is also available for download in MS Word [3 MB] and PDF [5 MB] format.
Data Explanatory Notes
All student data reported in this document are sourced from customised data requests to the Australian Government Department of Education[1] and the Social Research Centre[2]. Data on enrolment shares are taken from the Department’s TCSI data collection, and data on student experience are taken from the Quality Indicators for Learning and Teaching (QILT) Student Experience Survey.
In preparing this report:
Mode of attendance is defined as either external (off-campus, online), internal (on-campus, classroom based), and multi-modal (a mix of external and internal study).[3]
For the purposes of aggregation and presentation of results, cell counts of less than 5 for enrolment shares were replaced with the value “2”.
Some longitudinal analysis is provided, but the focus is on the most recent data available, which is for 2023.
Analysis includes both Table A and Table B universities as defined under the Higher Education Support Act 2003[4].
The identification of students from low SES, regional, and remote backgrounds is based on their first address.
“Equity students” refers to students who belong to at least one of the key equity groups presented in this report, namely, students with disability, First Nations Australian students, and students from low SES, regional, and remote areas[5].
“Non-equity students” refers to students who do not belong to any of the key equity groups described above.
Mode of attendance in Australian higher education
In Australian higher education, students engage in study through one of three modes of attendance:
Internal – where learning occurs on campus in traditional classroom or face-to-face settings.
External – also referred to as off-campus or online learning, where students complete their studies remotely.
Multi-modal – a hybrid approach that combines elements of both internal and external study, offering students a mix of in-person and online learning experiences.
External study offers significant flexibility, allowing students to study from any location and manage competing demands, such as employment or caring responsibilities.
Students from equity groups are more likely to enrol in external (off-campus) study, likely due to its flexibility and accessibility[6]. However, there are notable challenges associated with external study, such as lower retention rates, reduced engagement with peers, limited access to campus-based support services, and a greater risk of social and academic isolation[7].
The availability and uptake of external study options vary considerably across universities. While some universities offer limited external attendance options, others offer extensive online offerings, often in partnership with third-party providers, such as Open Universities Australia (OUA) or Online Education Services (OES).
During the COVID-19 pandemic, almost all Australian higher education courses shifted temporarily to online delivery.
In this report, we present the mode of attendance of domestic undergraduate students over the past three years, covering the period during and after the COVID-19 pandemic.
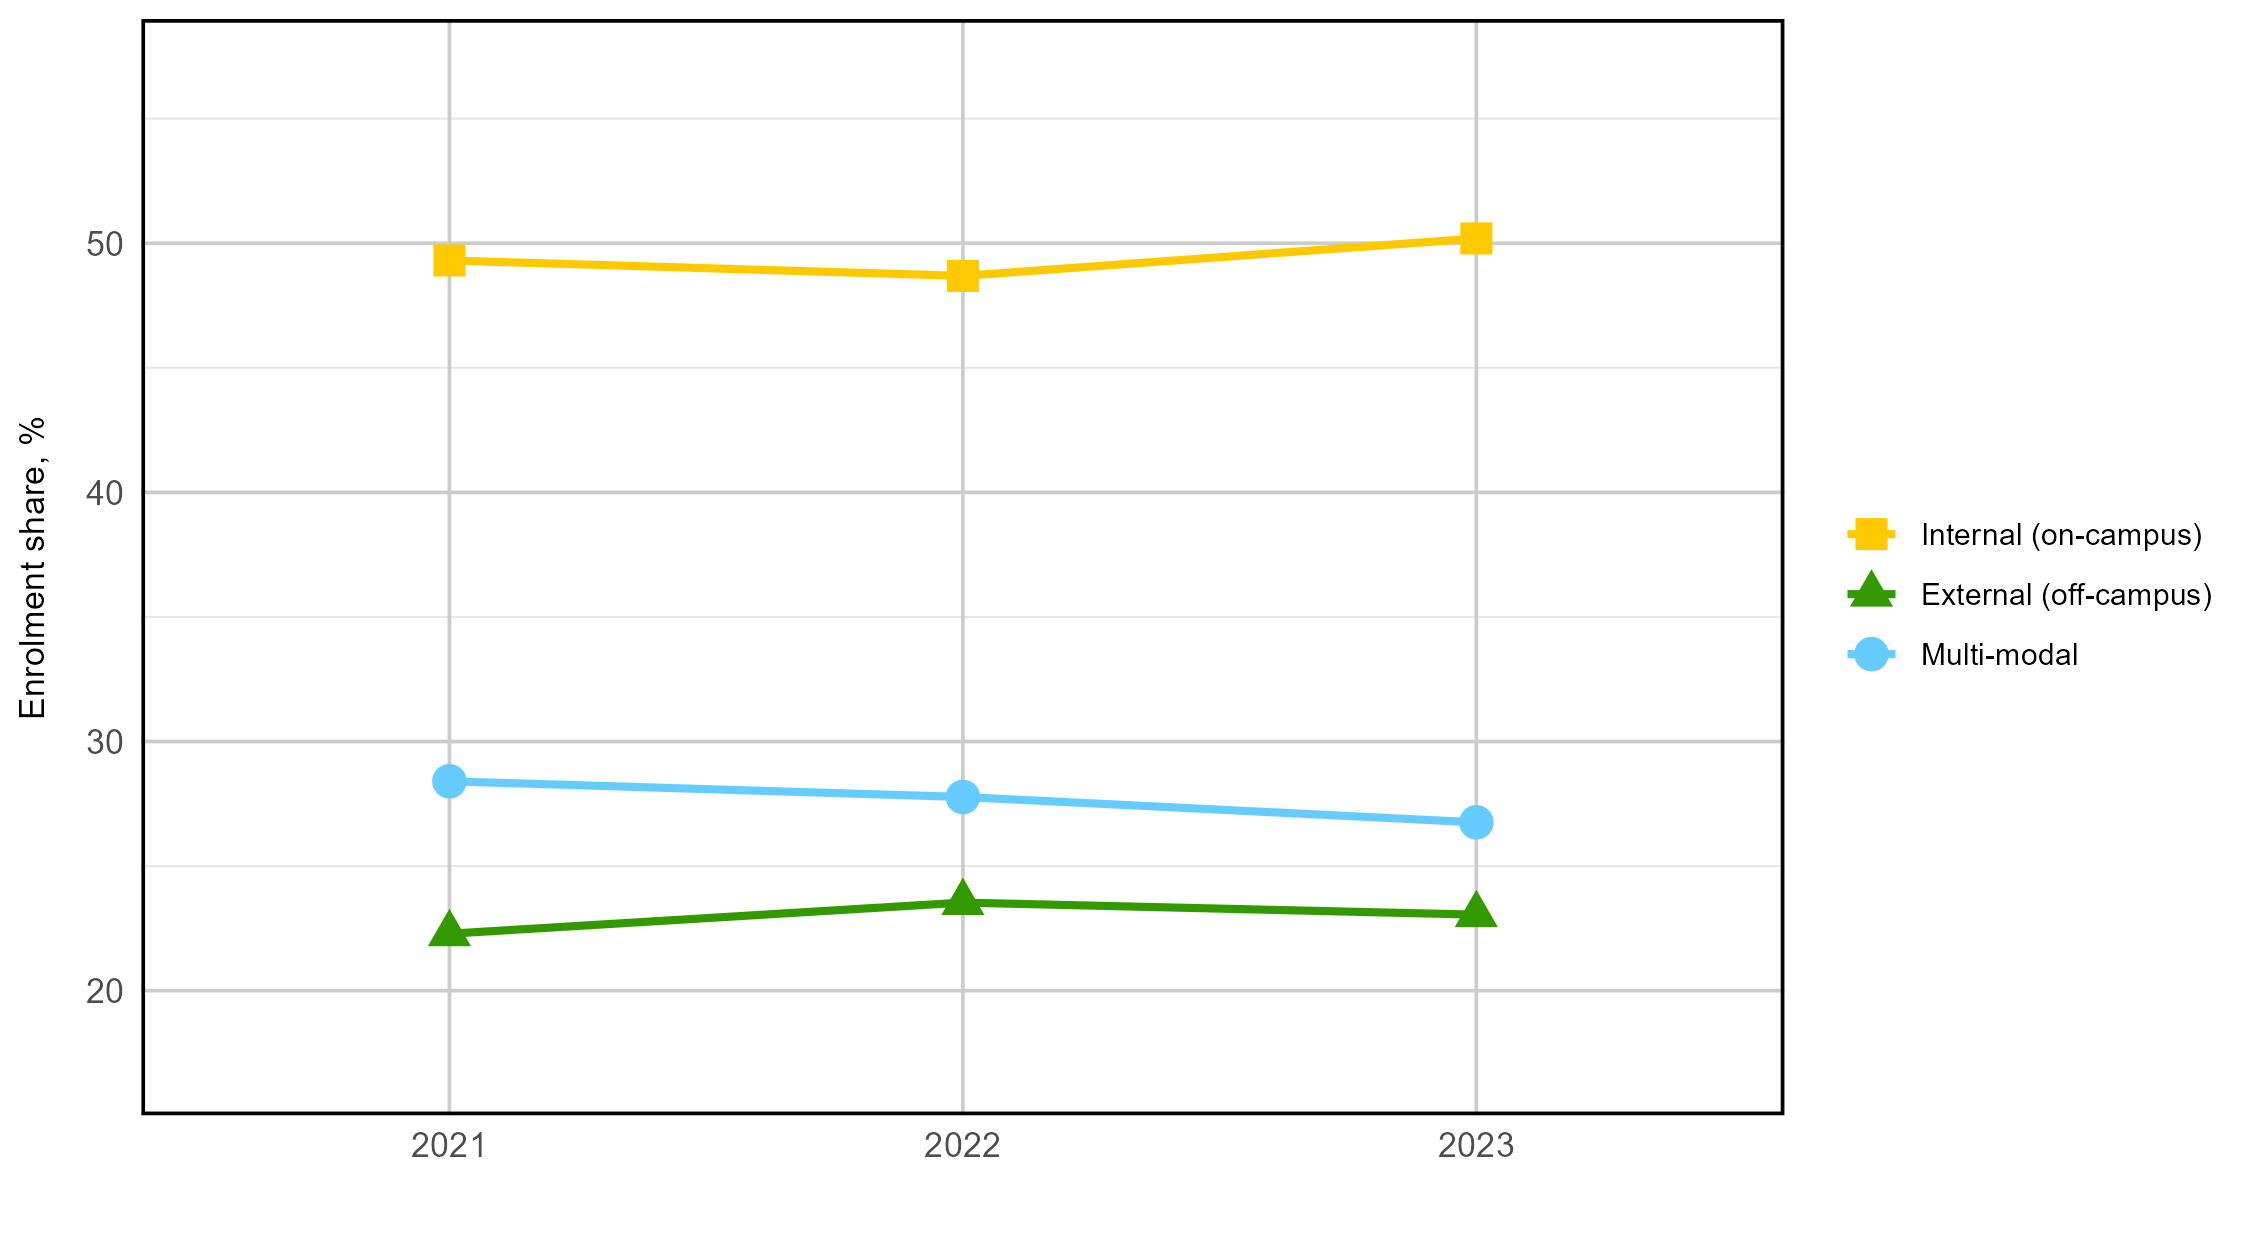
Mode of attendance for all undergraduate domestic students has been relatively stable
From 2021 to 2023, internal enrolment shares increased from 49.3% to 50.2%, external enrolment increased from 22.3% to 23.1%, and multi-modal enrolment decreased from 28.4% to 26.8%.
Figure 1: Mode of attendance of domestic undergraduate students between 2021 and 2023 enrolled at Table A and B universities.
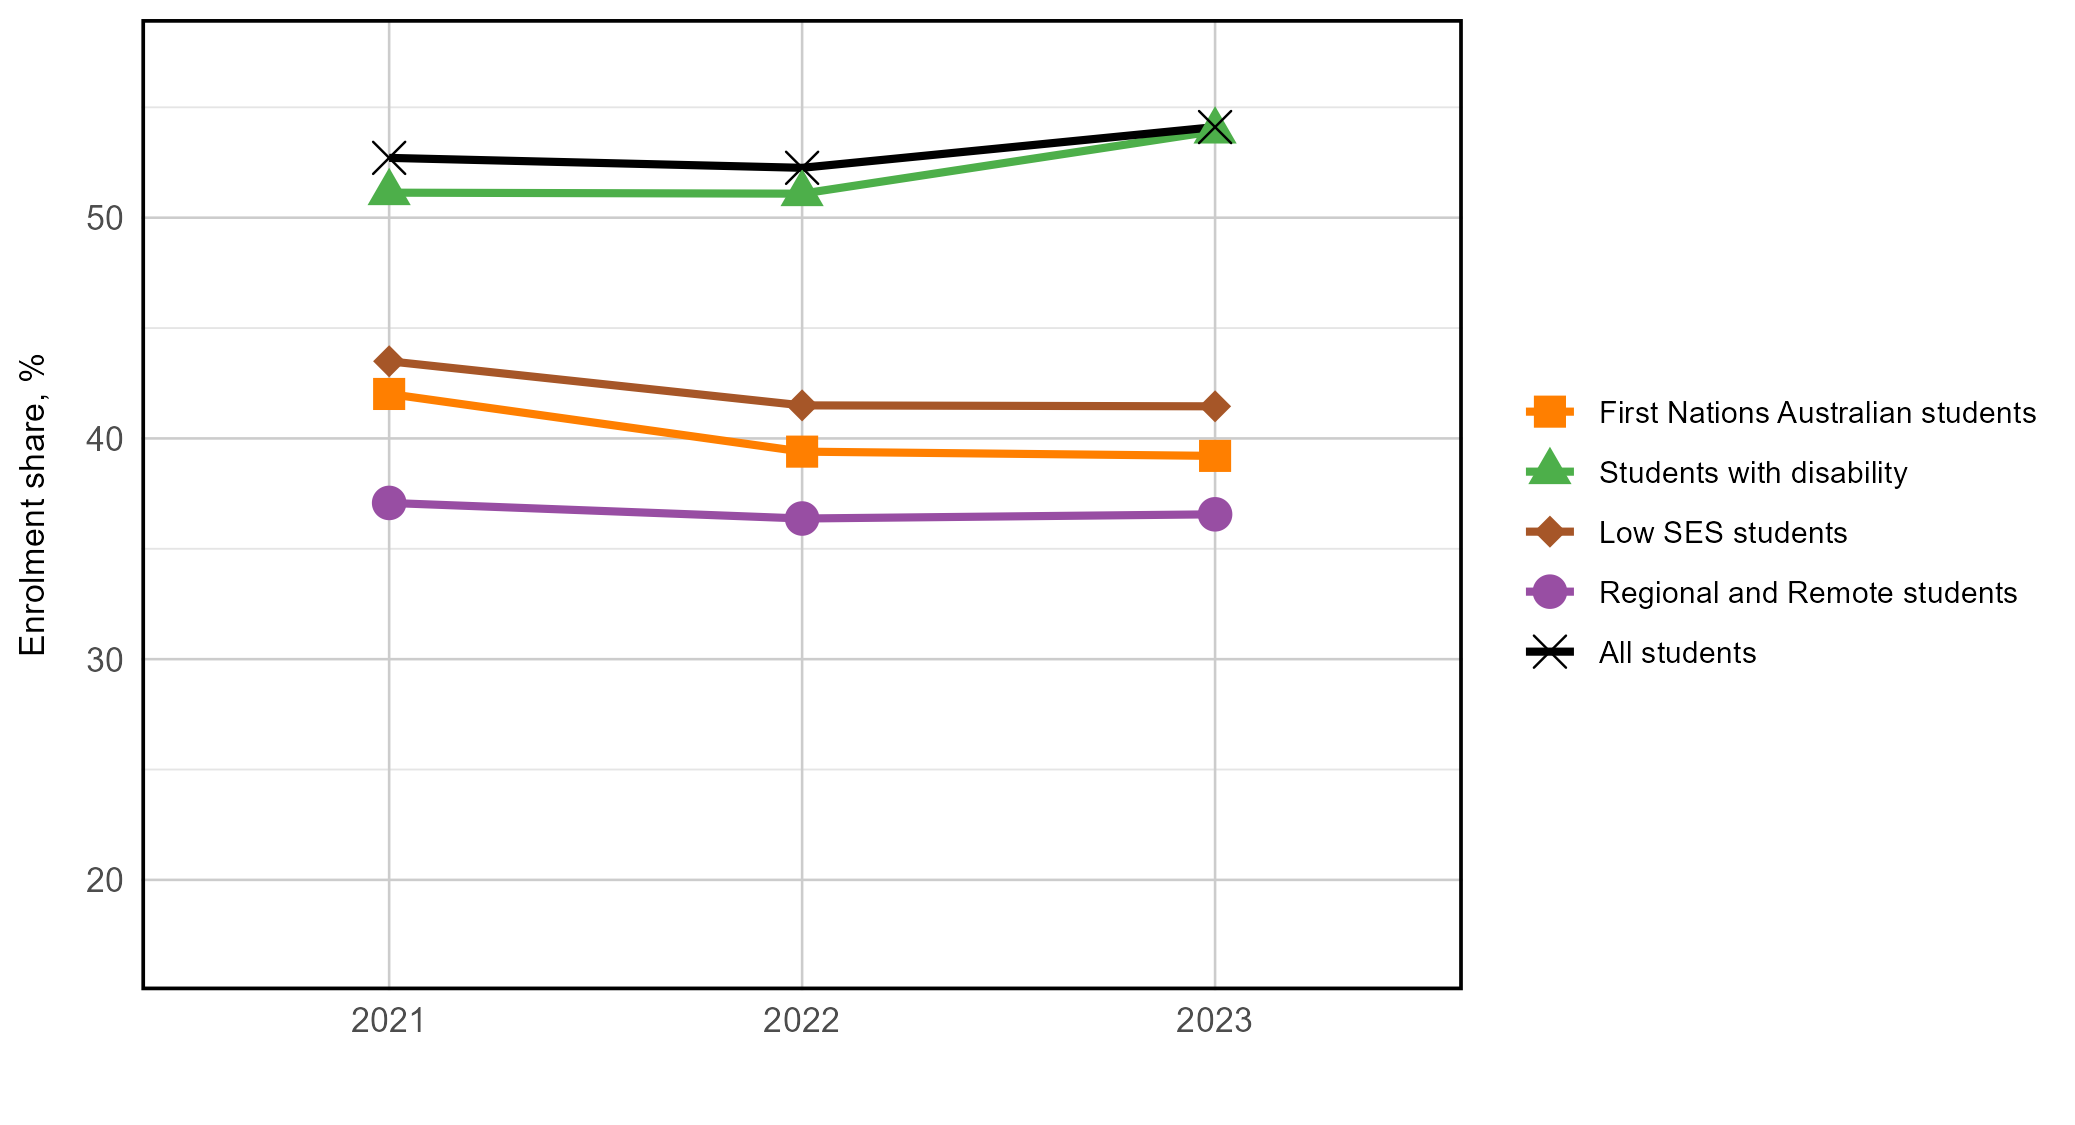
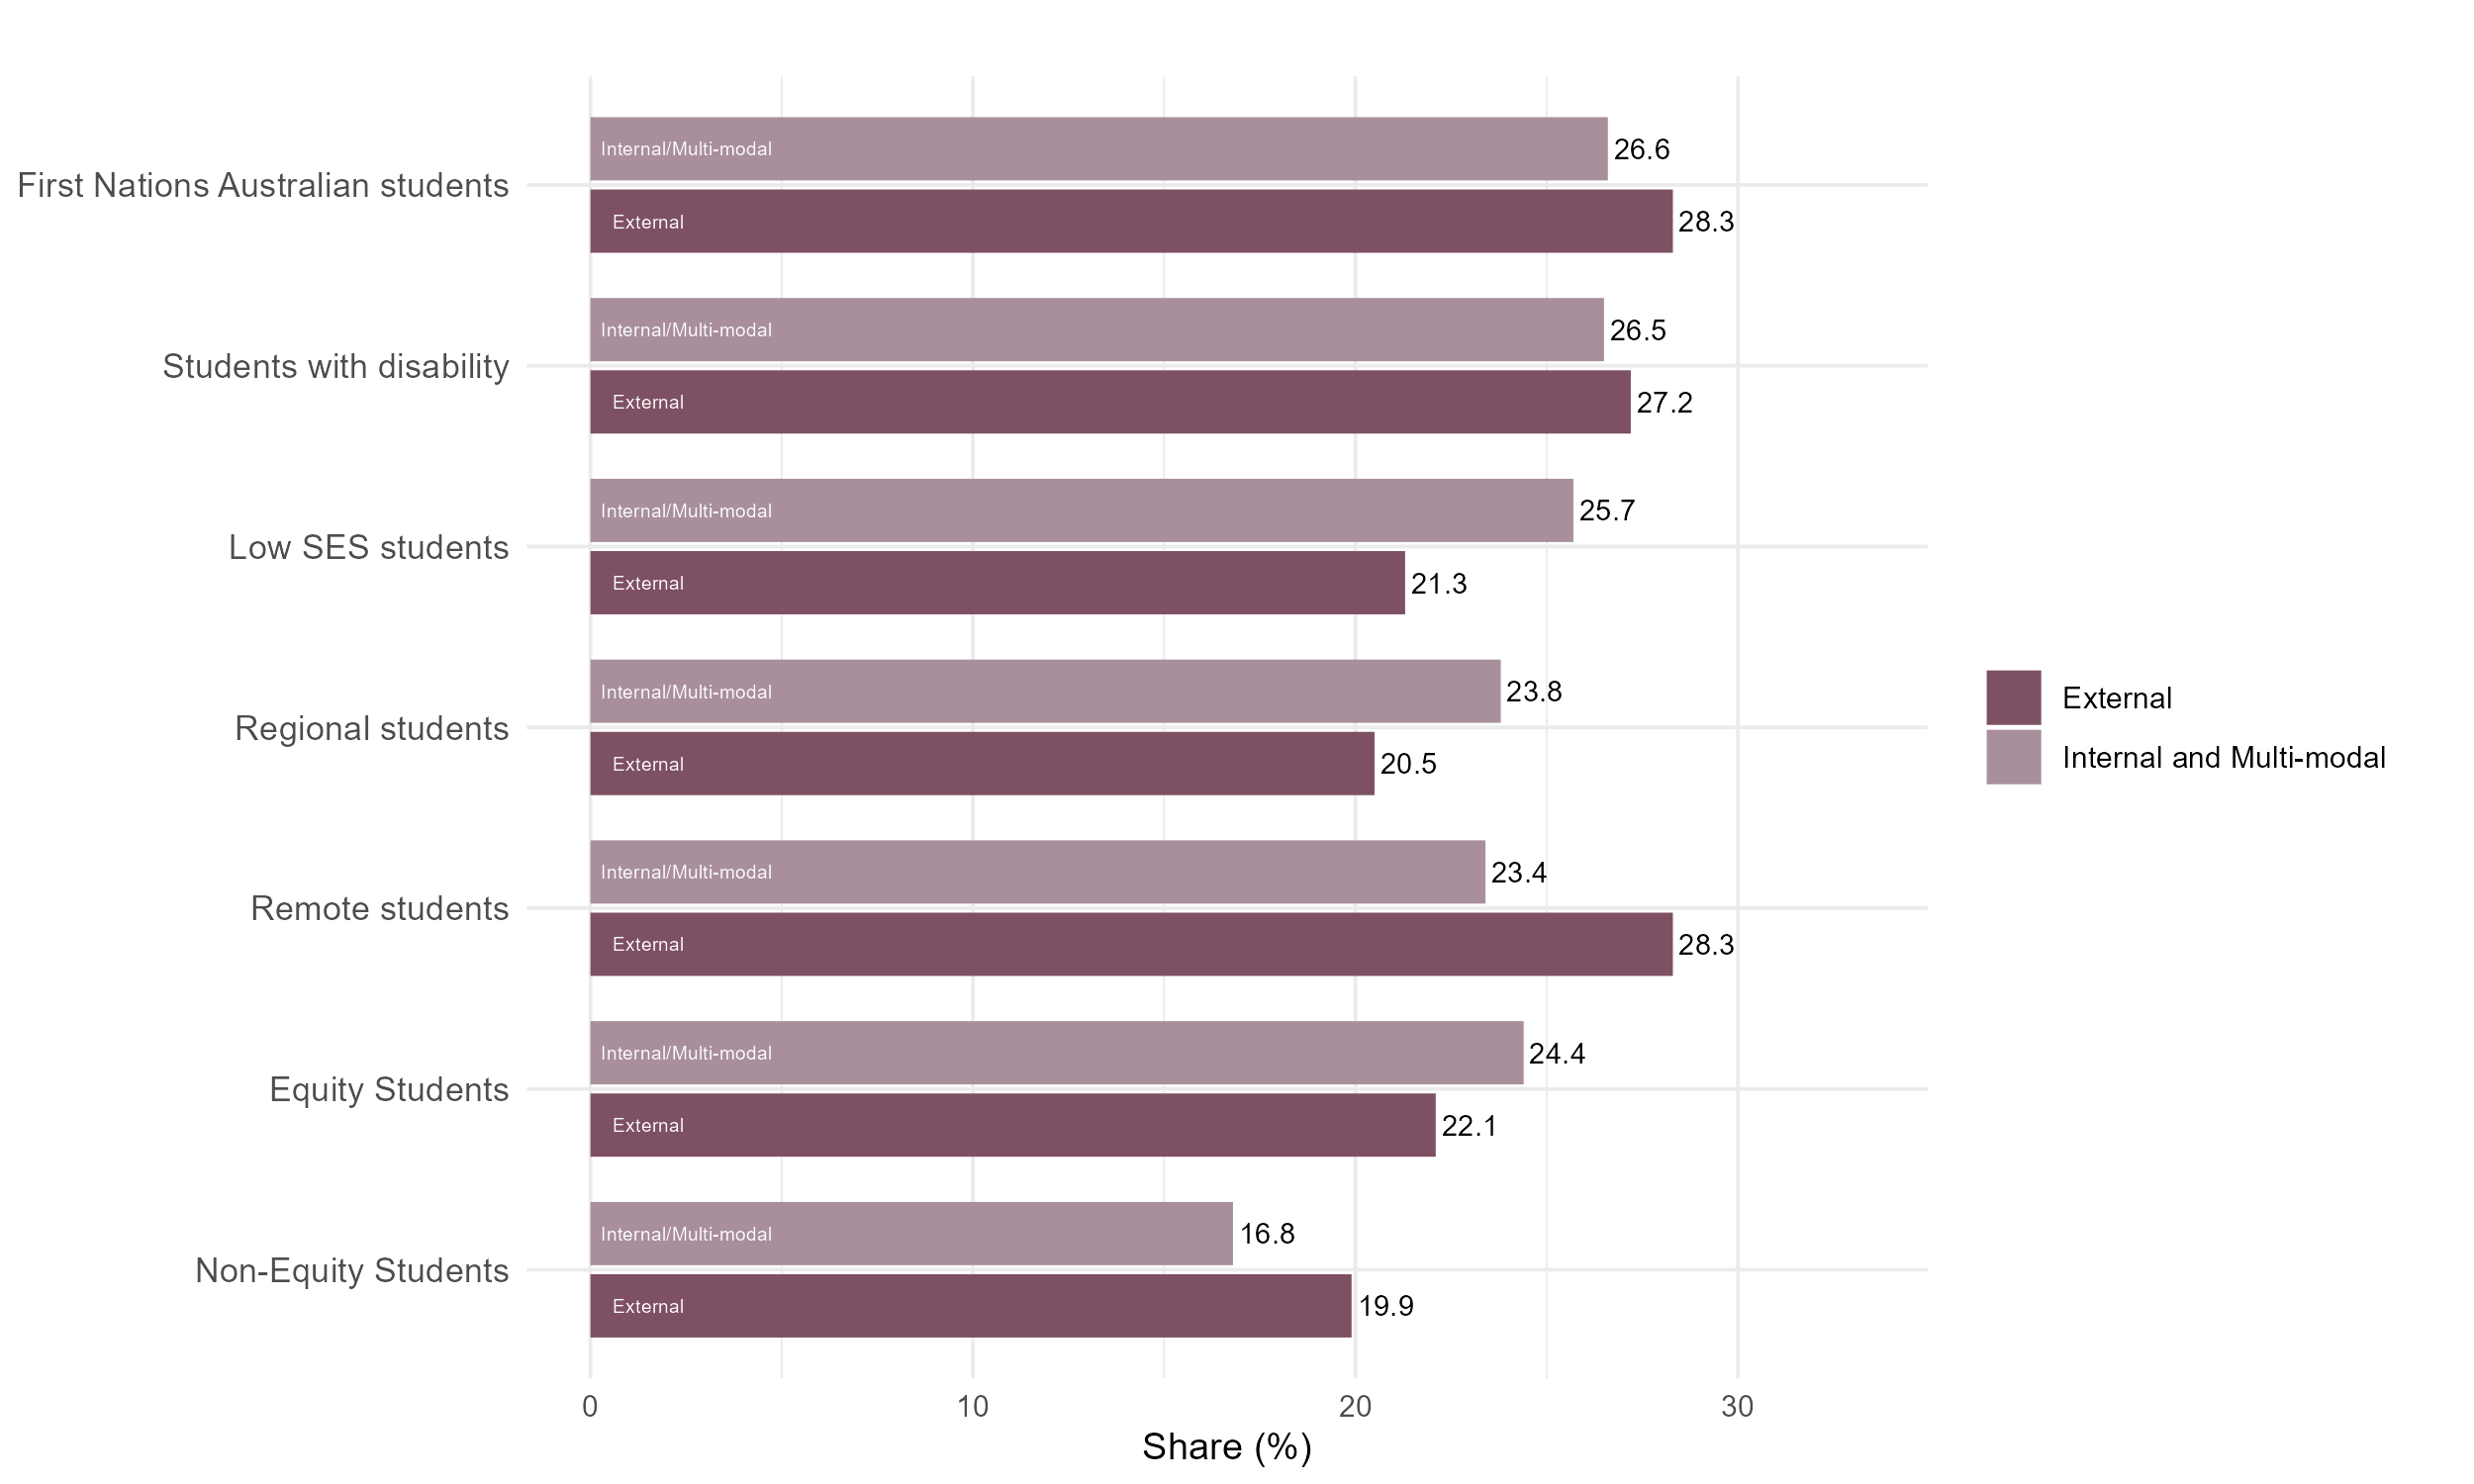
Lower internal enrolment shares for equity students
Between 2021 and 2023, the internal enrolment shares for all student equity groups were lower than the internal enrolment shares for all students. Students with disability had the highest level of internal enrolments (which increased from 2022 to 2023), while students from regional and remote areas had the lowest internal enrolment shares.
Figure 2: Internal enrolment shares for all domestic undergraduate student equity groups between 2021 and 2023 at Table A and B universities.
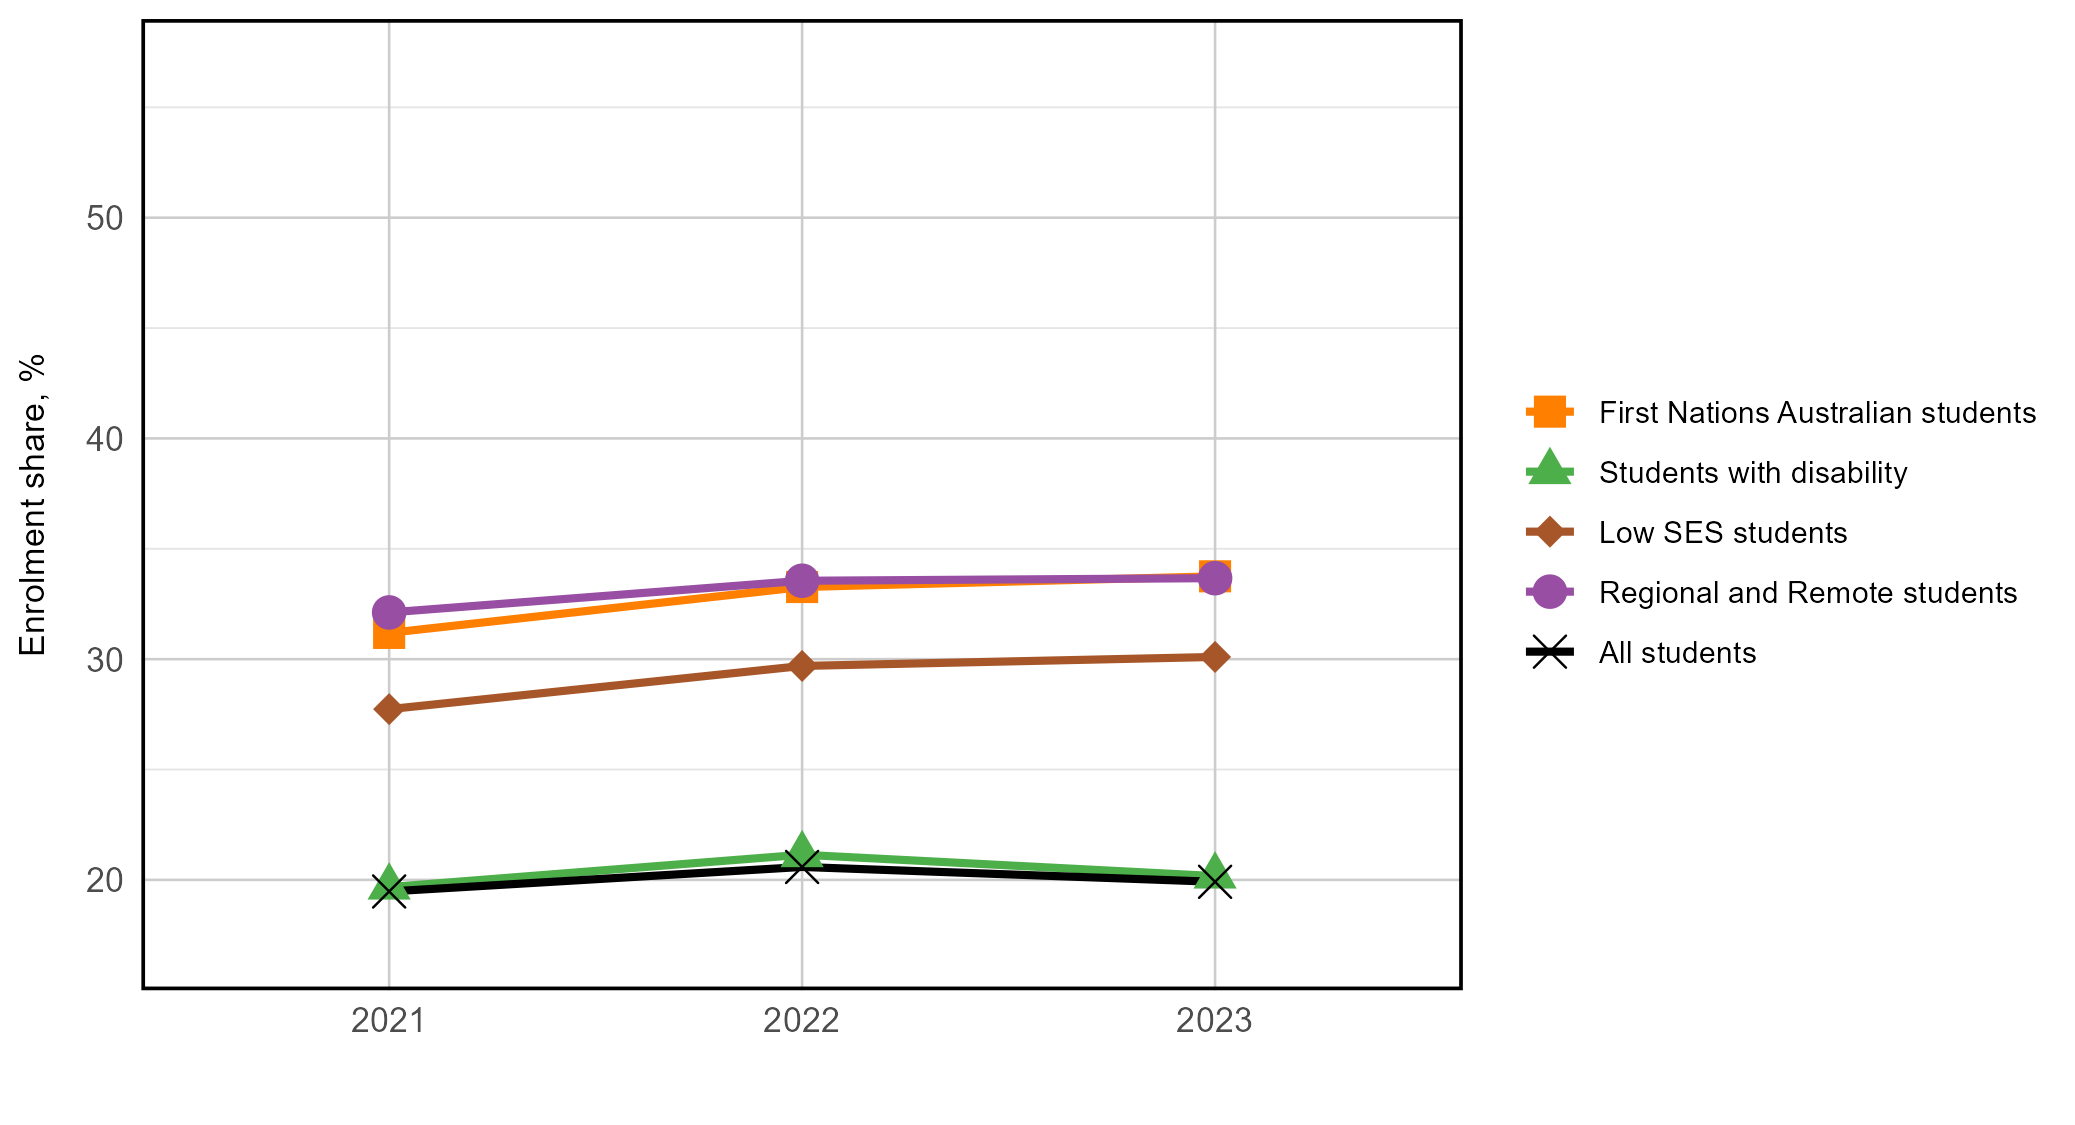
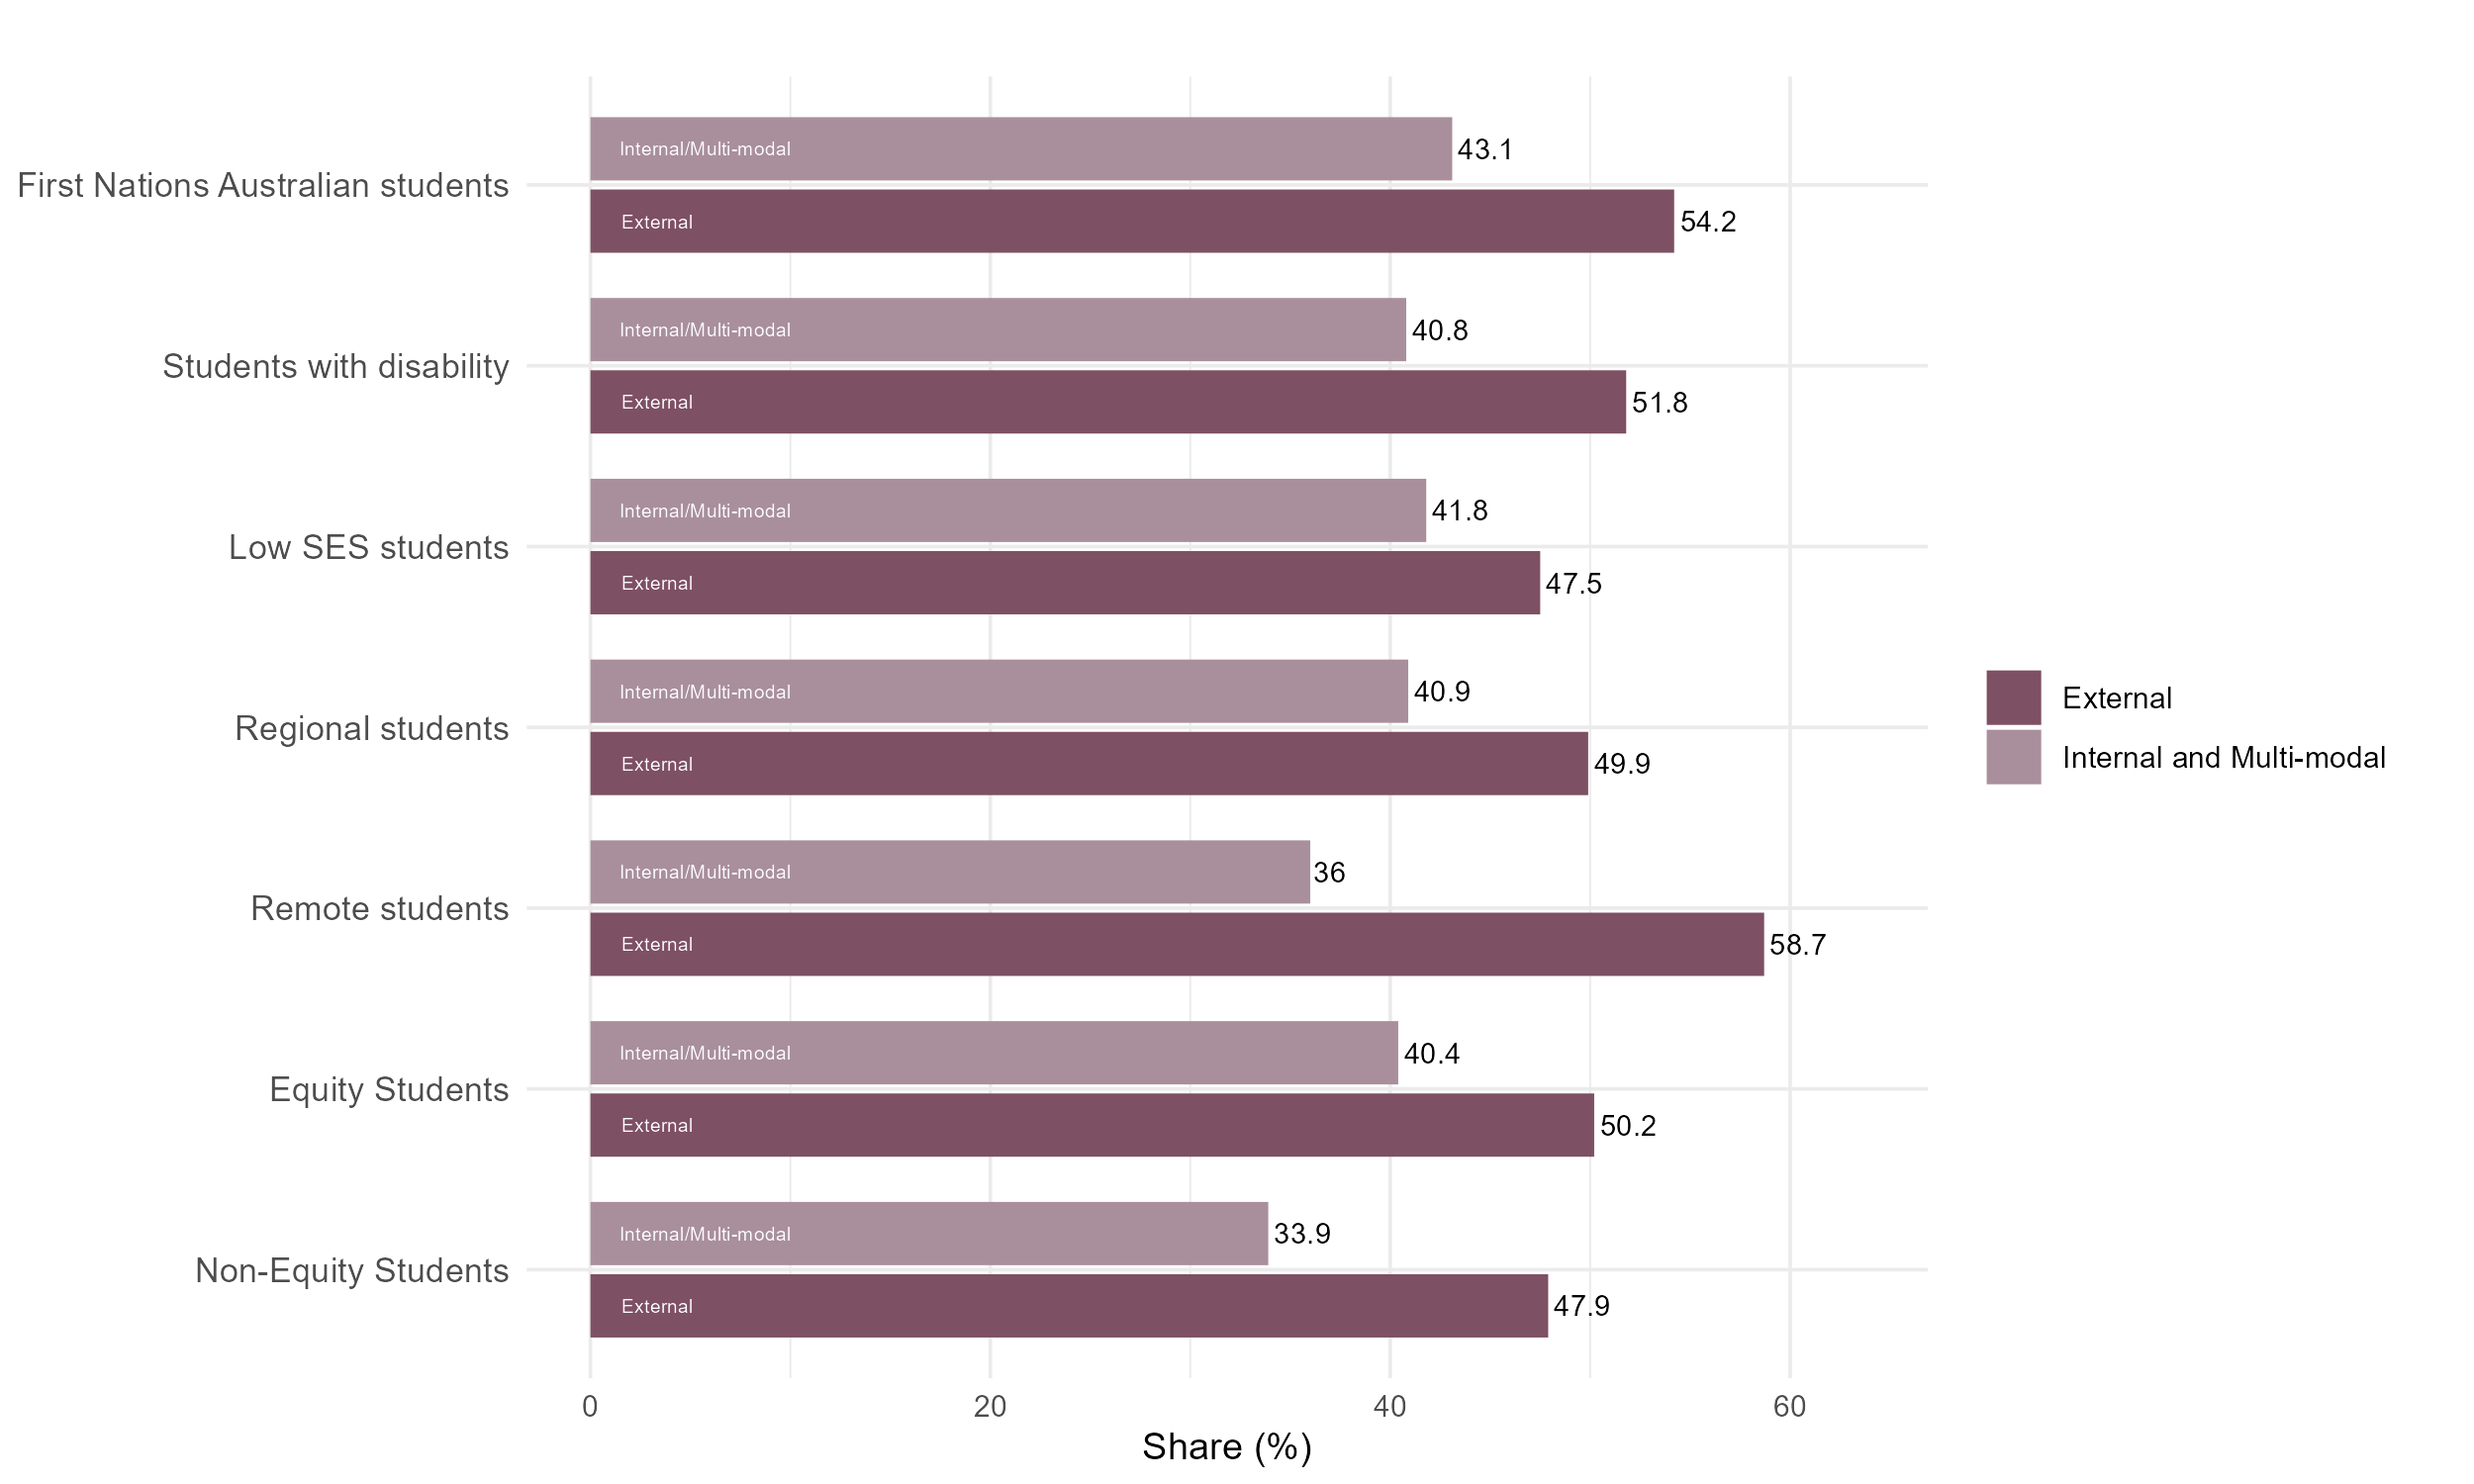
Higher external enrolment shares for equity students
Over the past three years, all equity groups had greater external (off-campus) student enrolments compared to all students. Among the equity groups, First Nations Australian students and students from regional and remote areas had the highest external enrolment, while students with disability had the lowest levels of external enrolment.
Figure 3: External (off-campus) enrolment shares for equity groups between 2021 and 2023 at Table A and B universities.
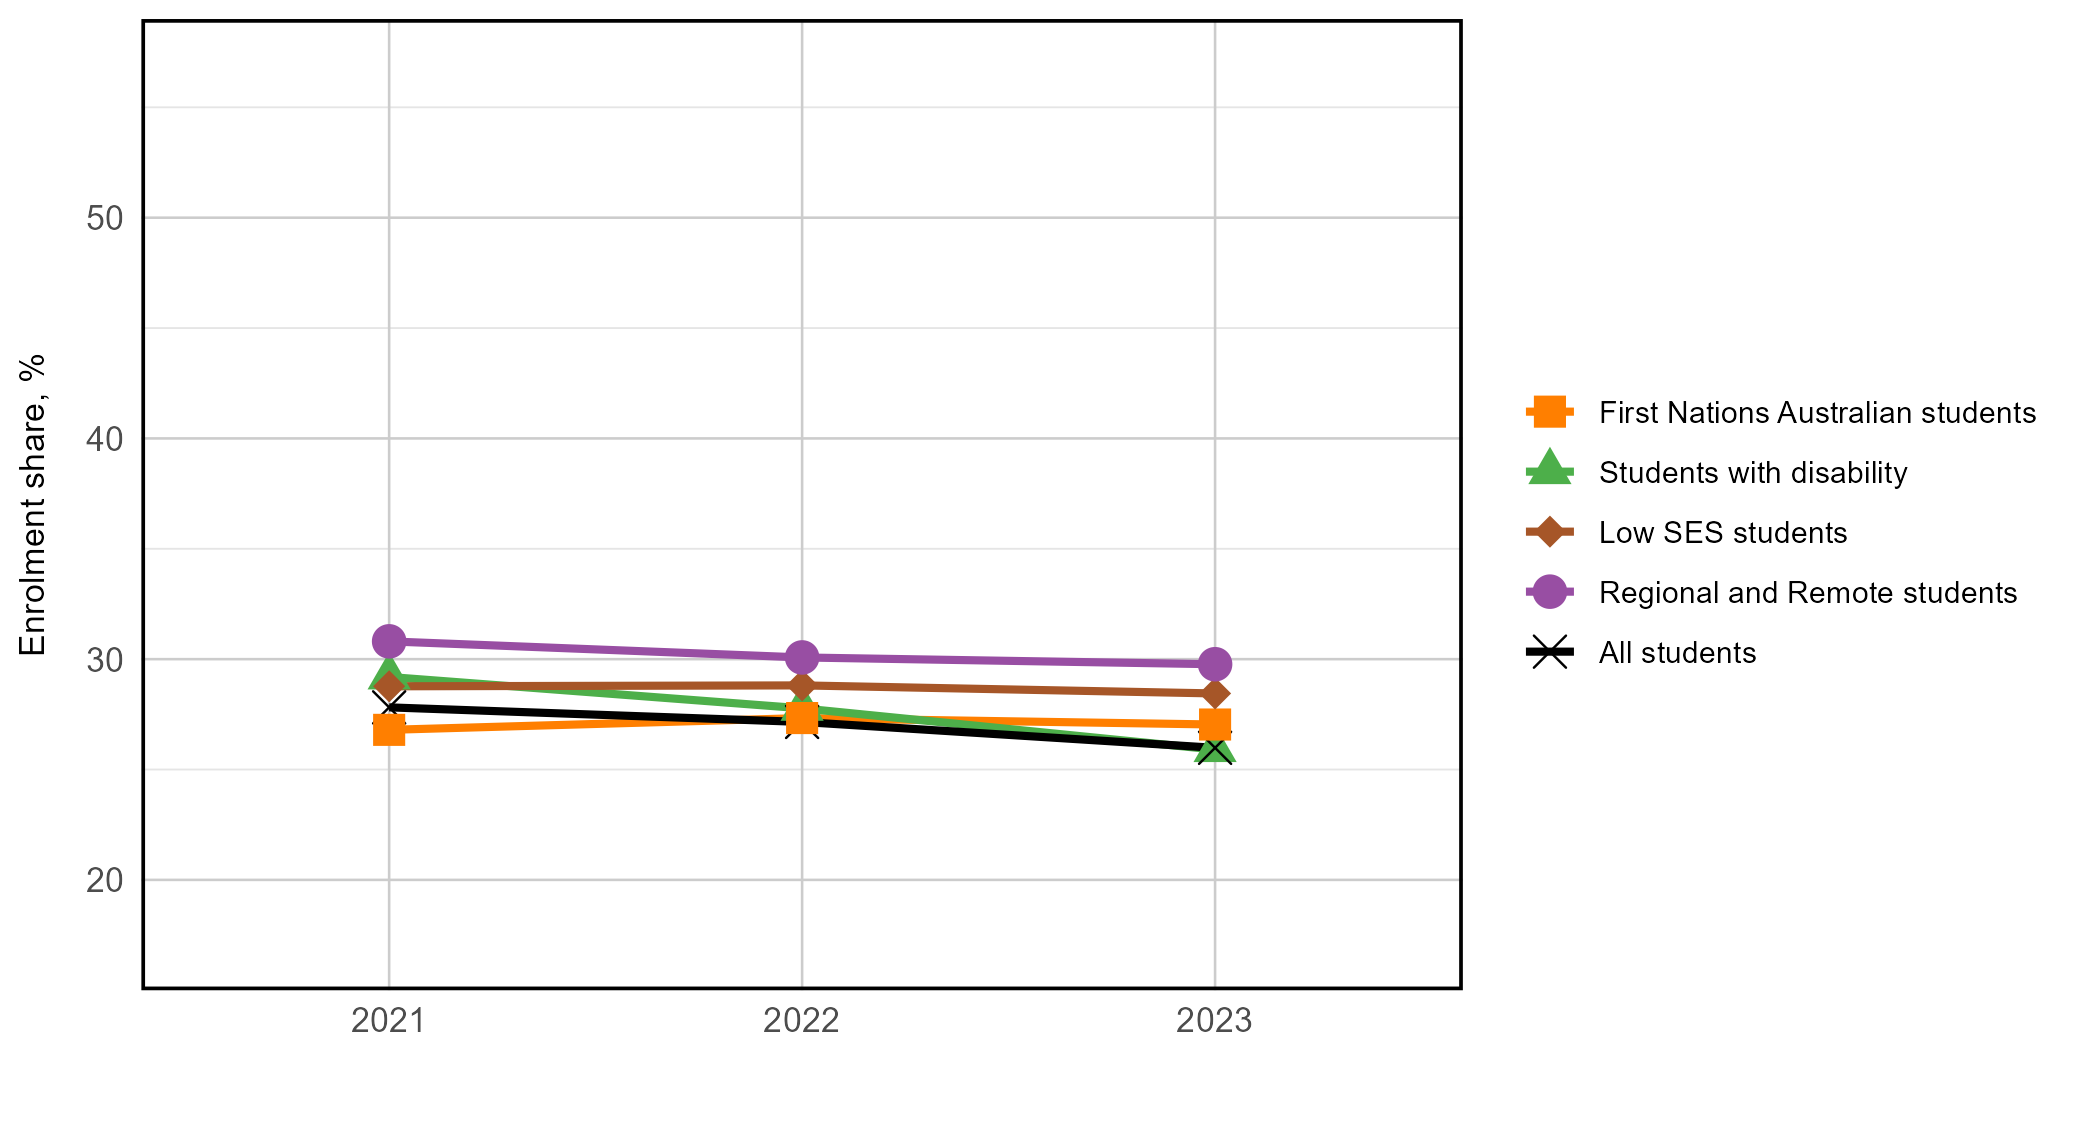
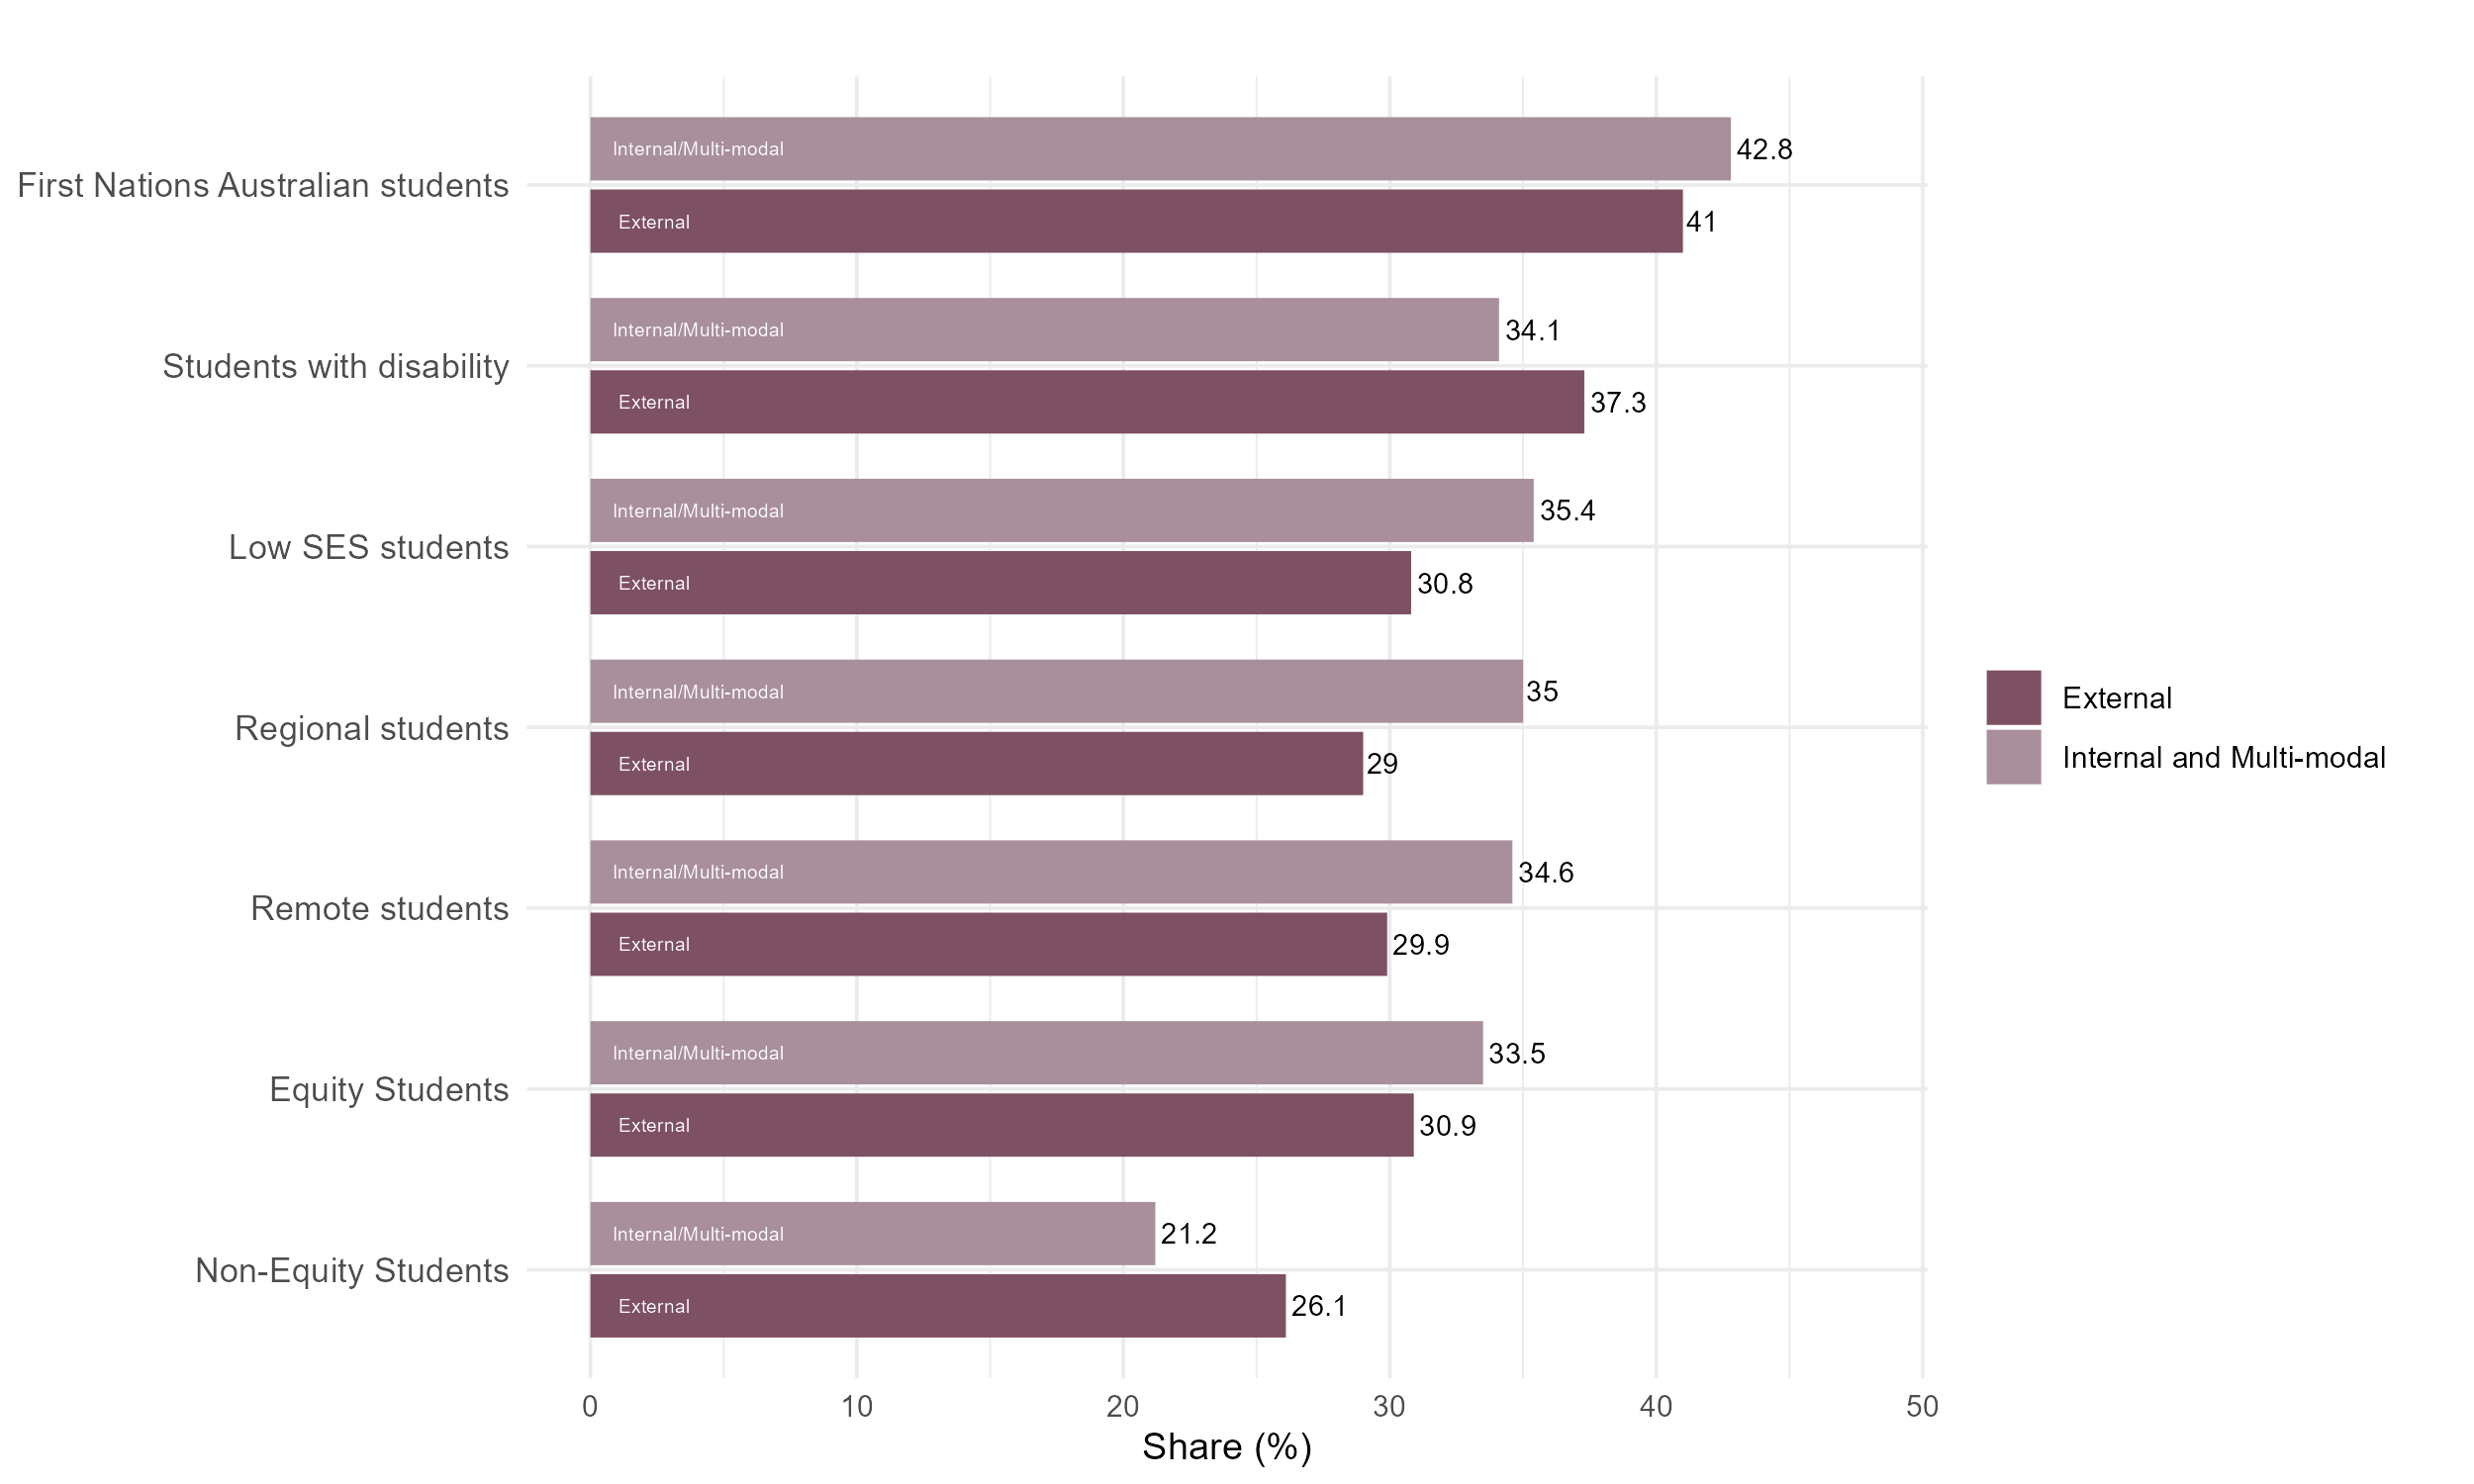
Similar multi-modal enrolment shares for equity students
Multi-modal student enrolment shares were stable over the past three years, with minimal differences between equity student groups. Students with disability showed the largest decrease from 29.2% in 2021 to 25.9% in 2023.
Figure 4: Multi-modal enrolment shares for equity groups between 2021 to 2023 at Table A and B universities.
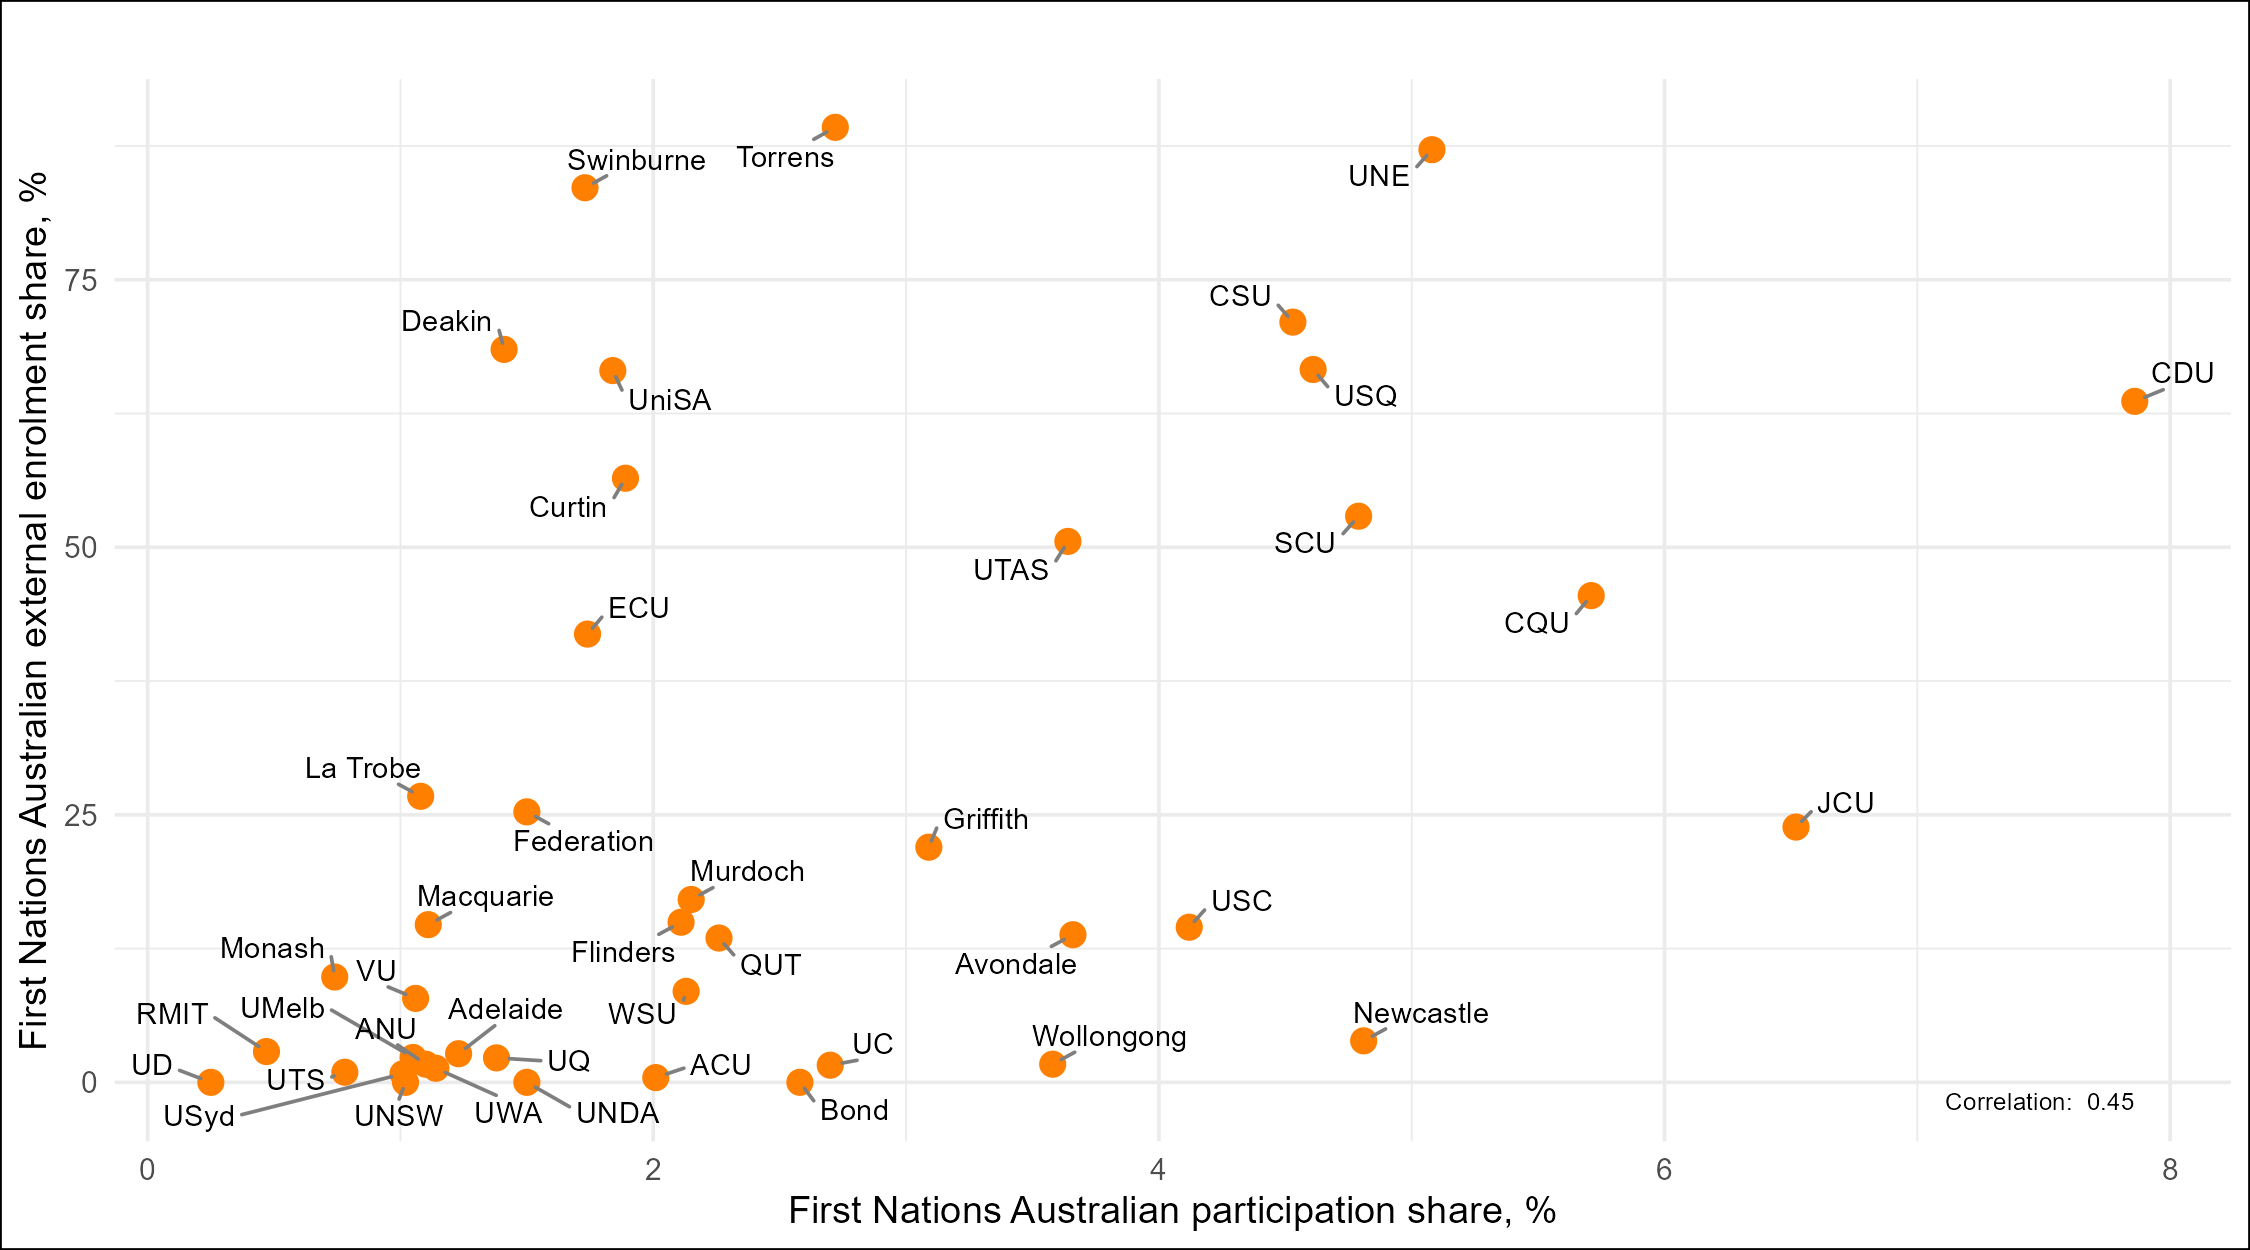
Positive correlation between participation shares and external enrolment shares of First Nations Australian students
Figure 5: Relationship between institutional participation shares and external student enrolment shares for First Nations Australian students at Table A and B universities.
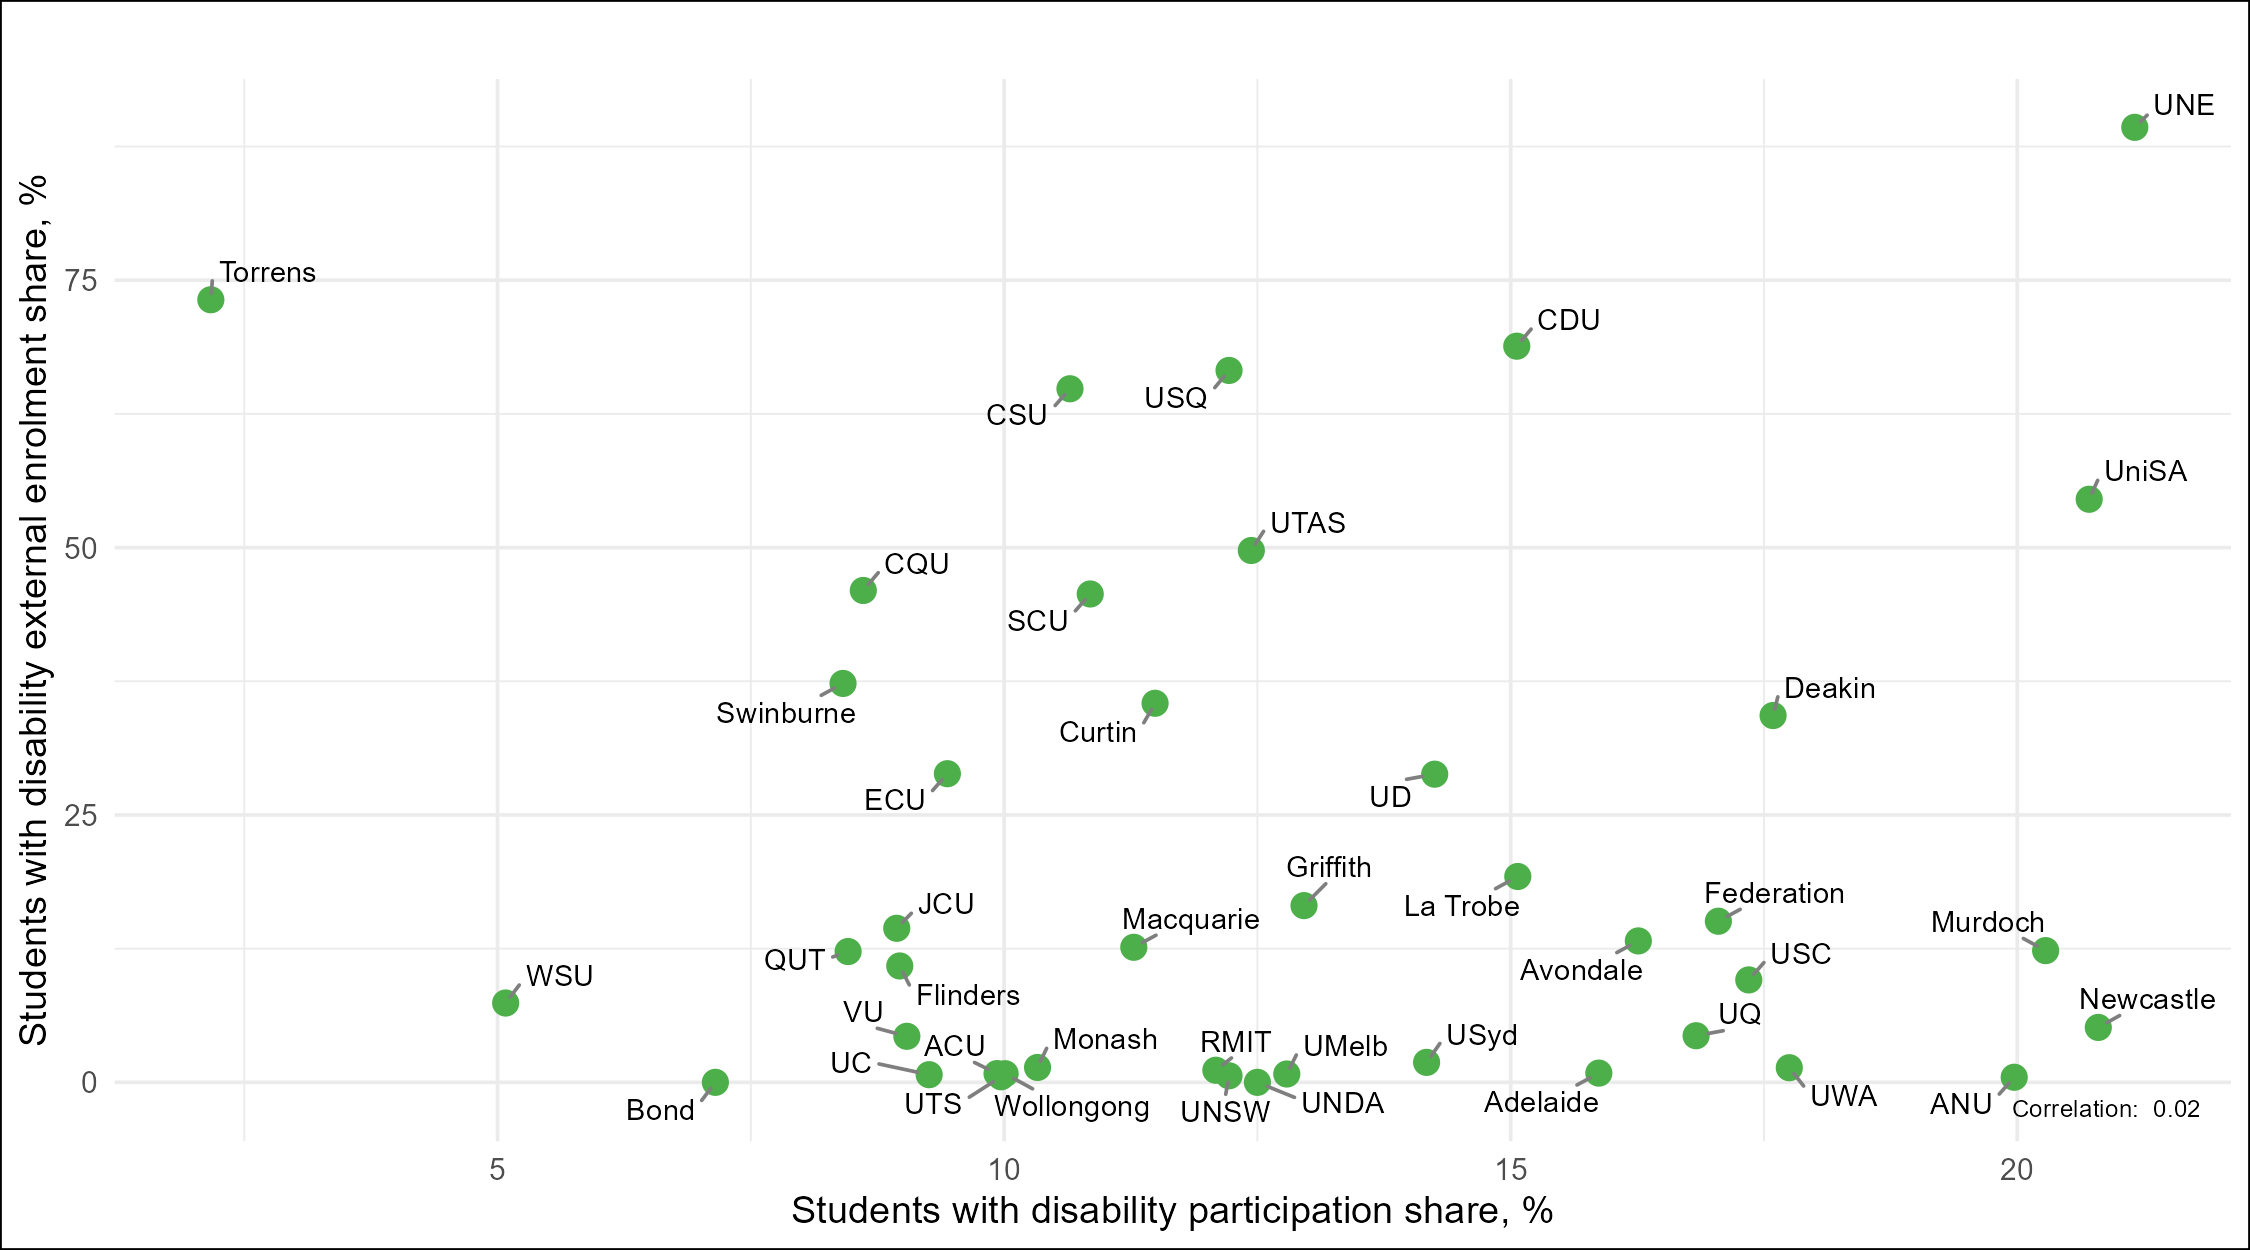
No correlation between participation shares and external enrolment shares of students with disability
Figure 6: Relationship between institutional participation shares and external student enrolment shares for students with disability at Table A and Table B universities.
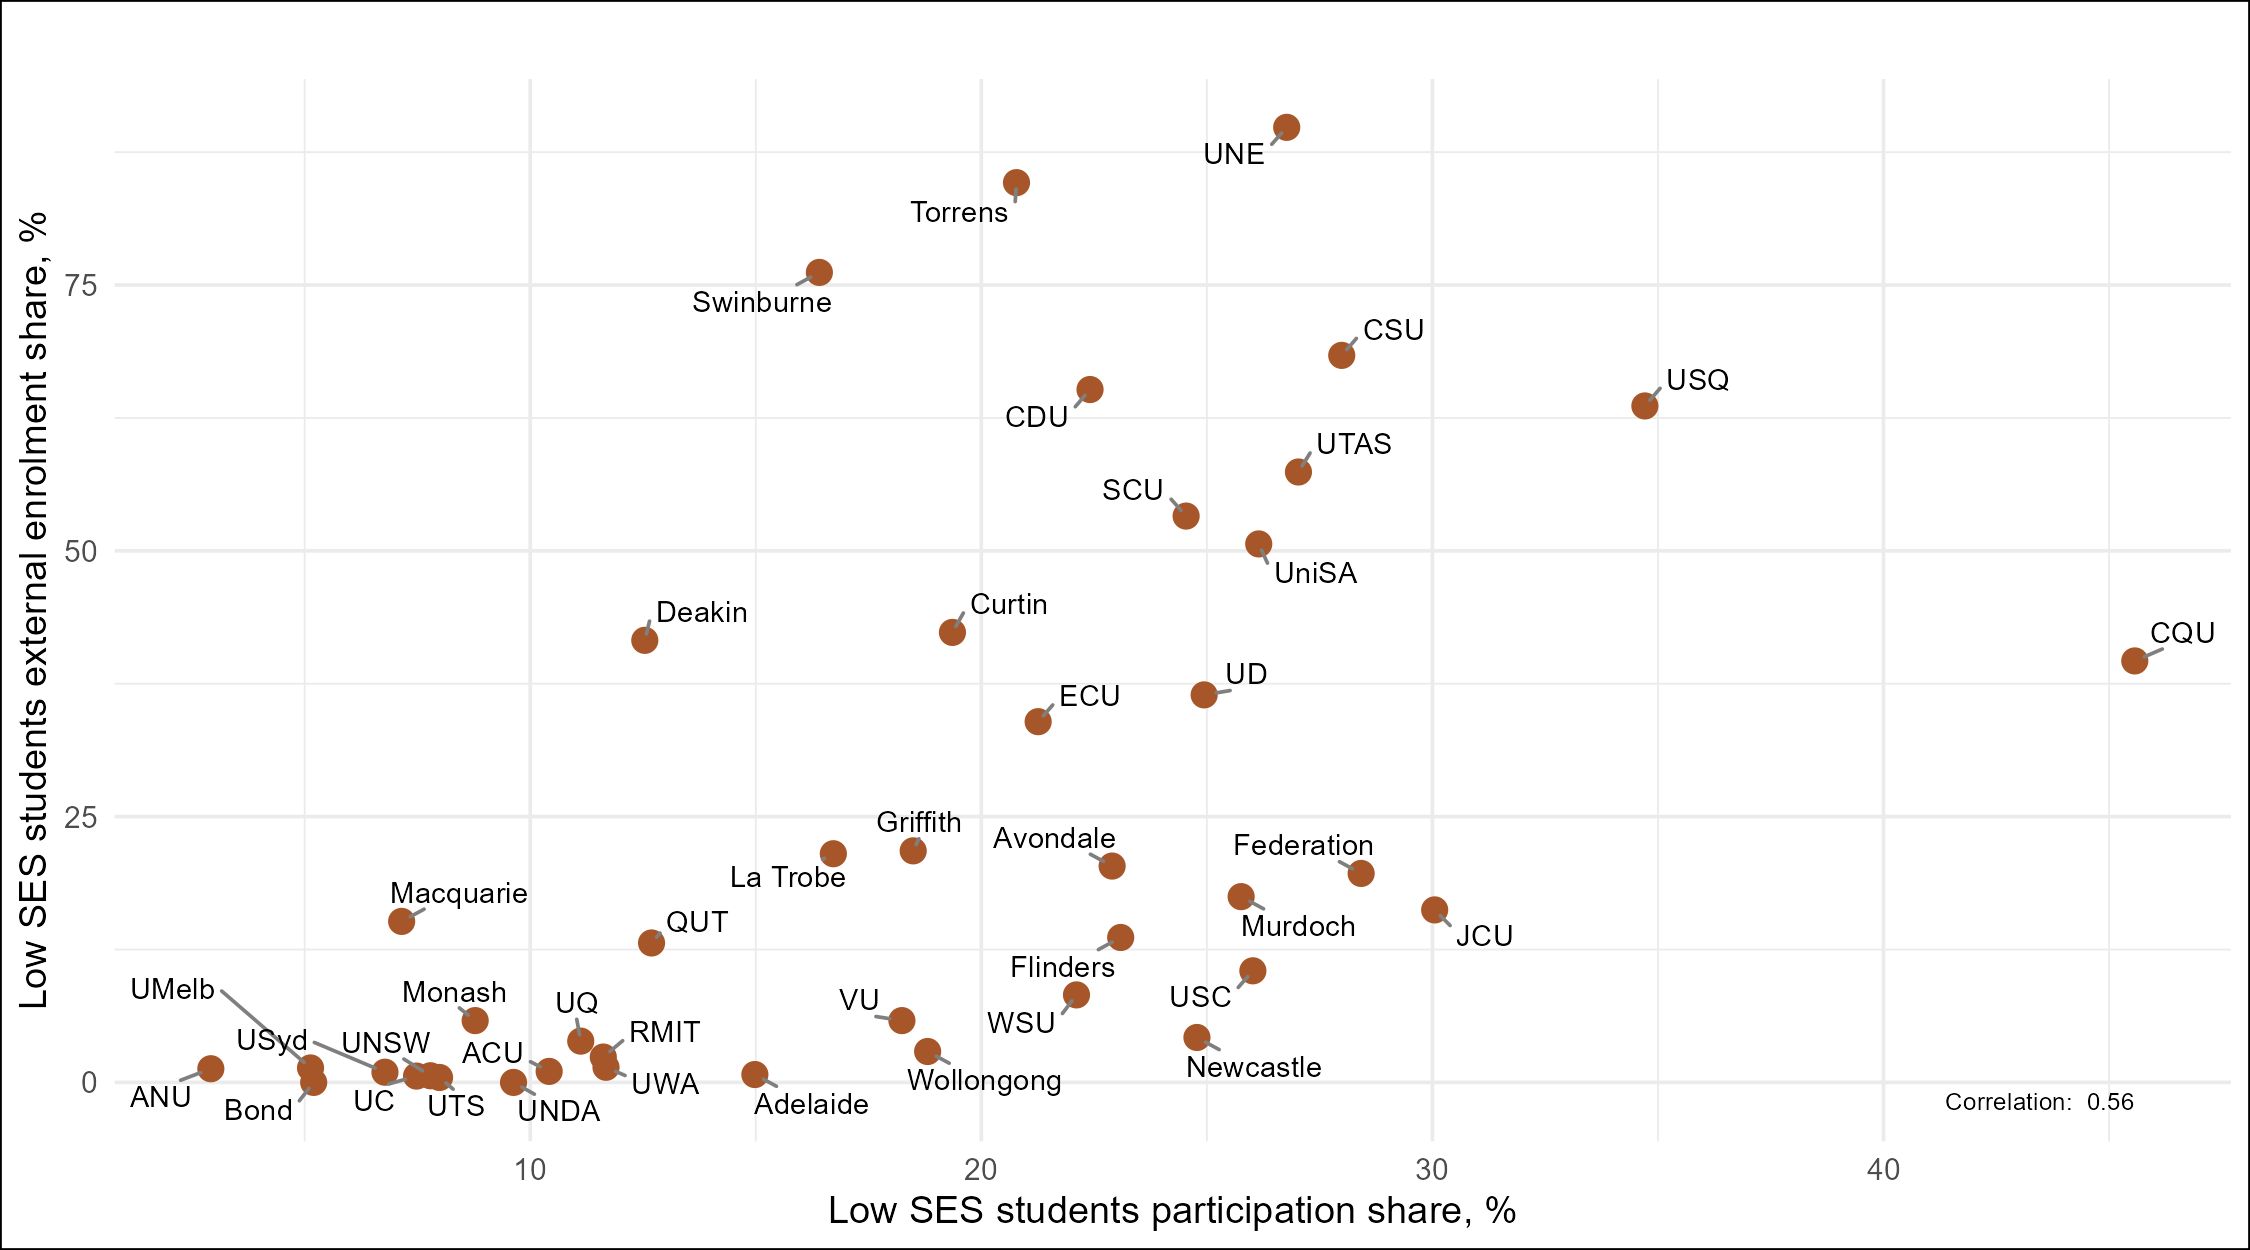
Positive correlation between participation shares and external enrolment shares of students from low SES areas
Figure 7: Relationship between institutional participation shares and external student enrolment shares for students from low SES areas at Table A and B universities.
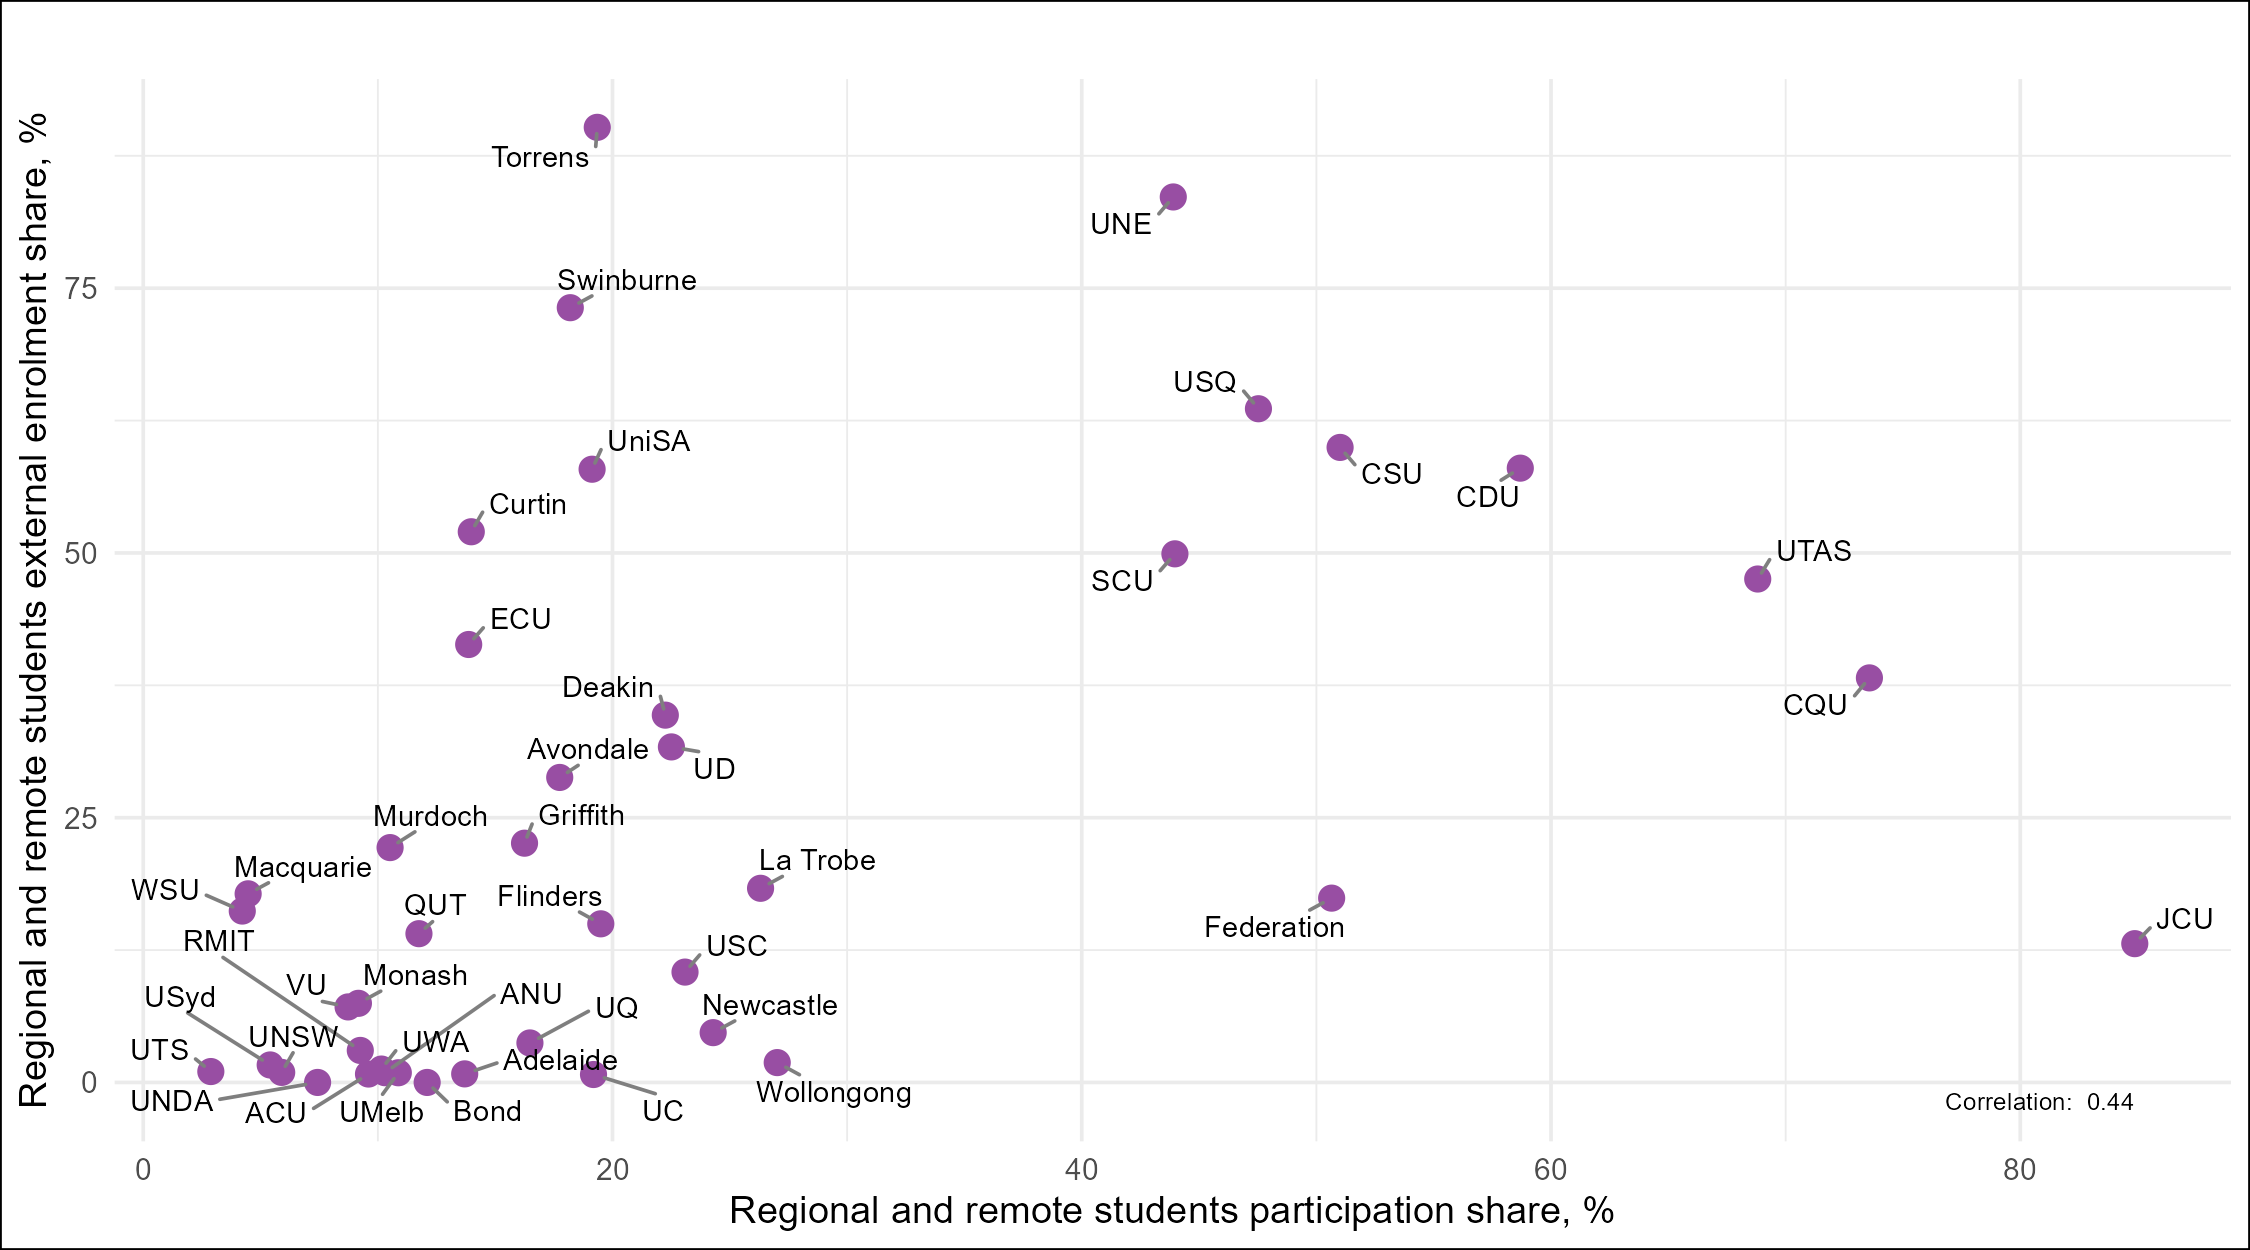
Positive correlation between participation share and external enrolment share of students from regional and remote areas
Figure 8: Relationship between institutional participation rate and external student enrolment for regional and remote students at Table A and B universities.
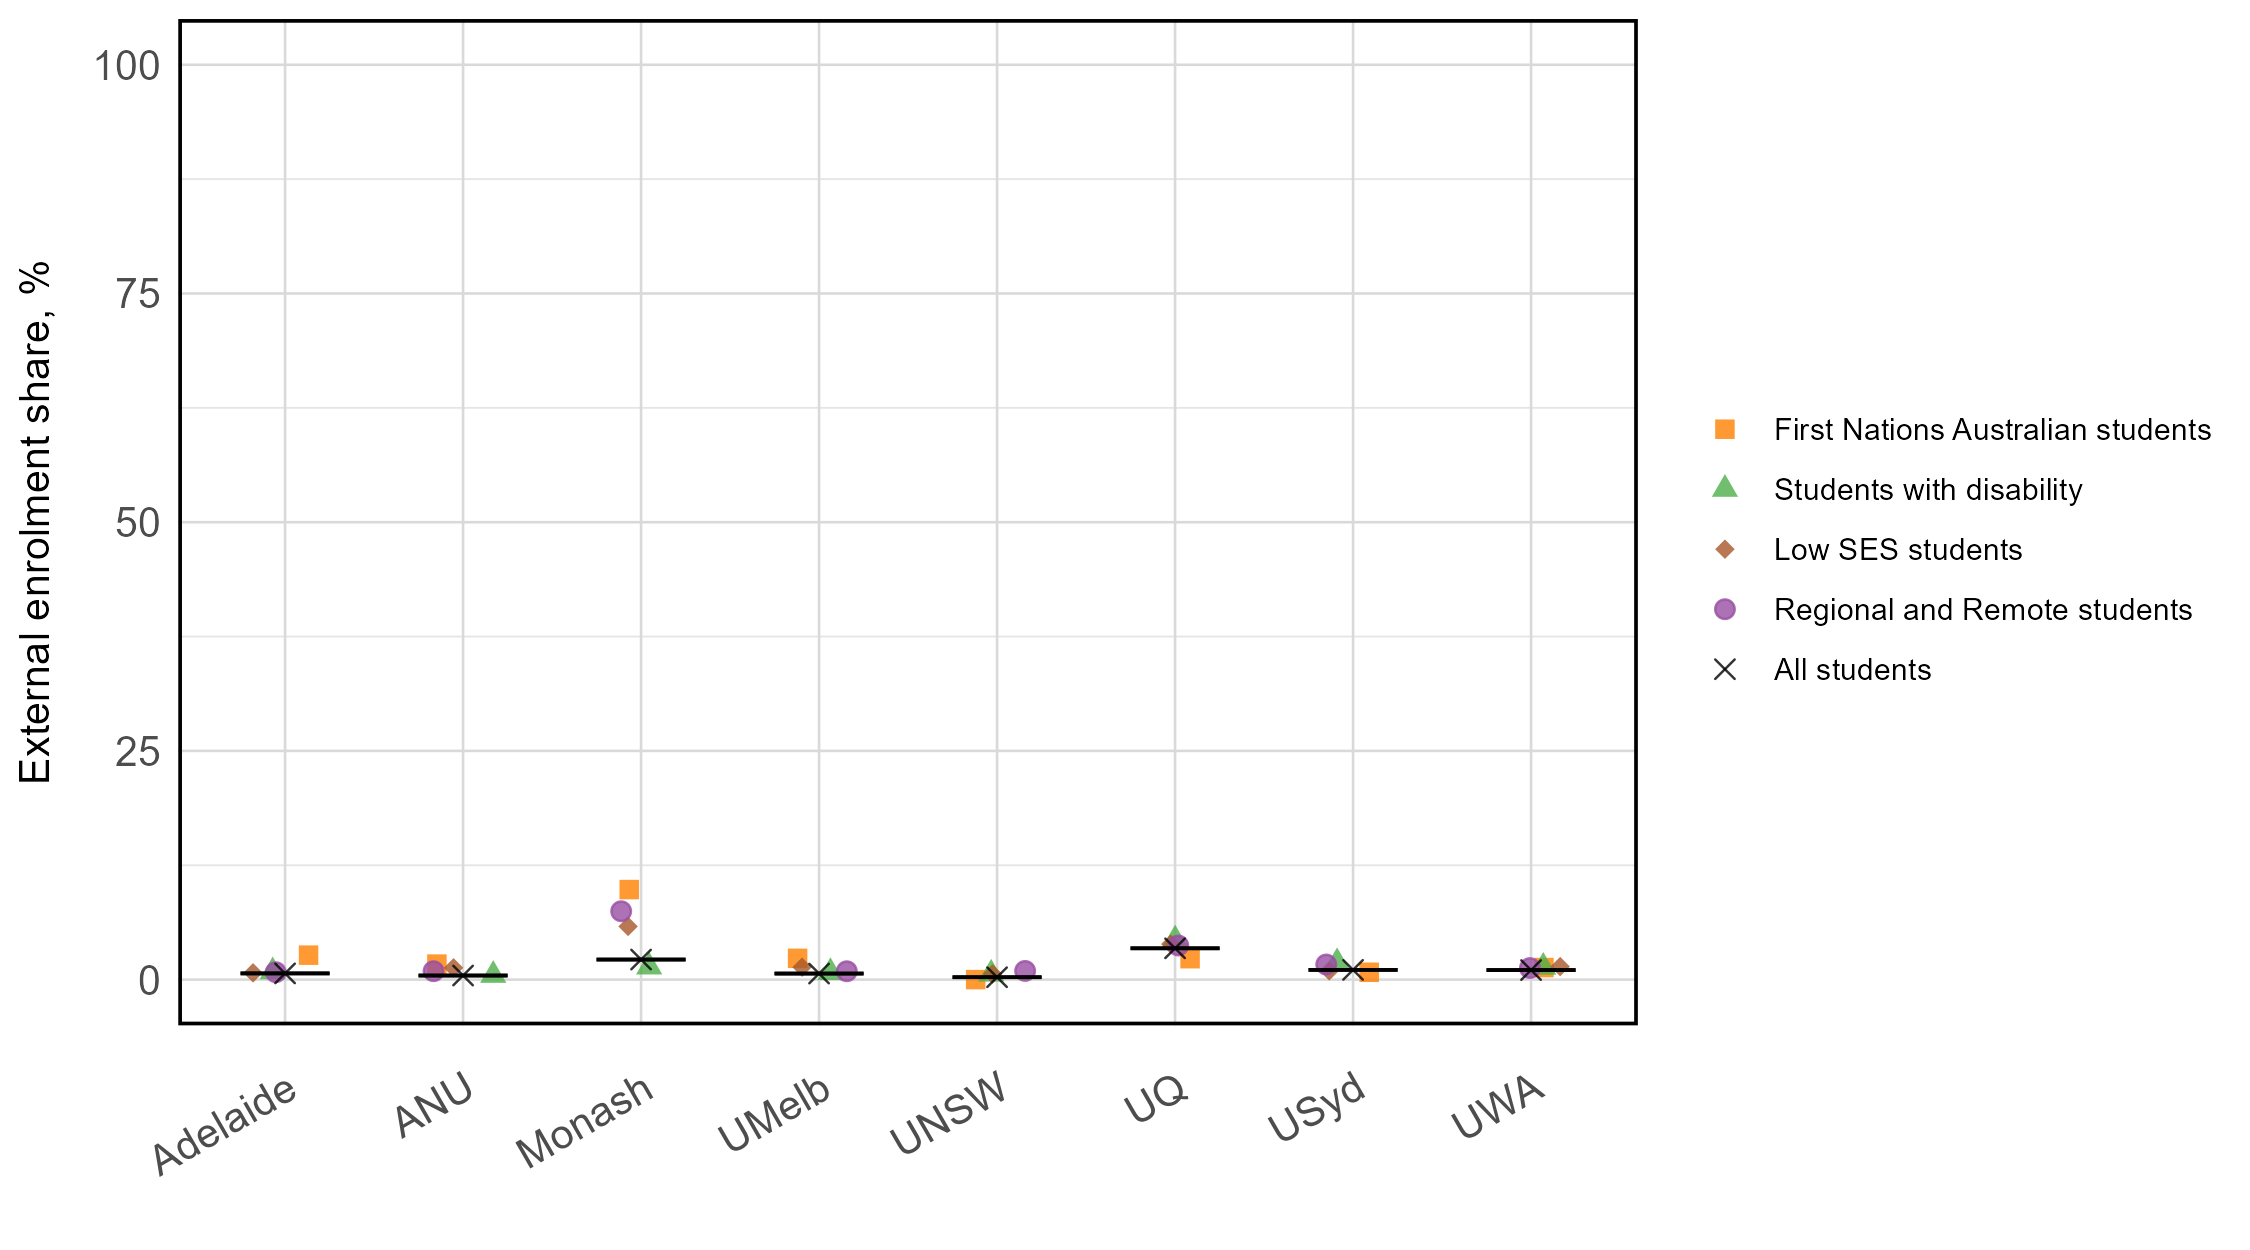
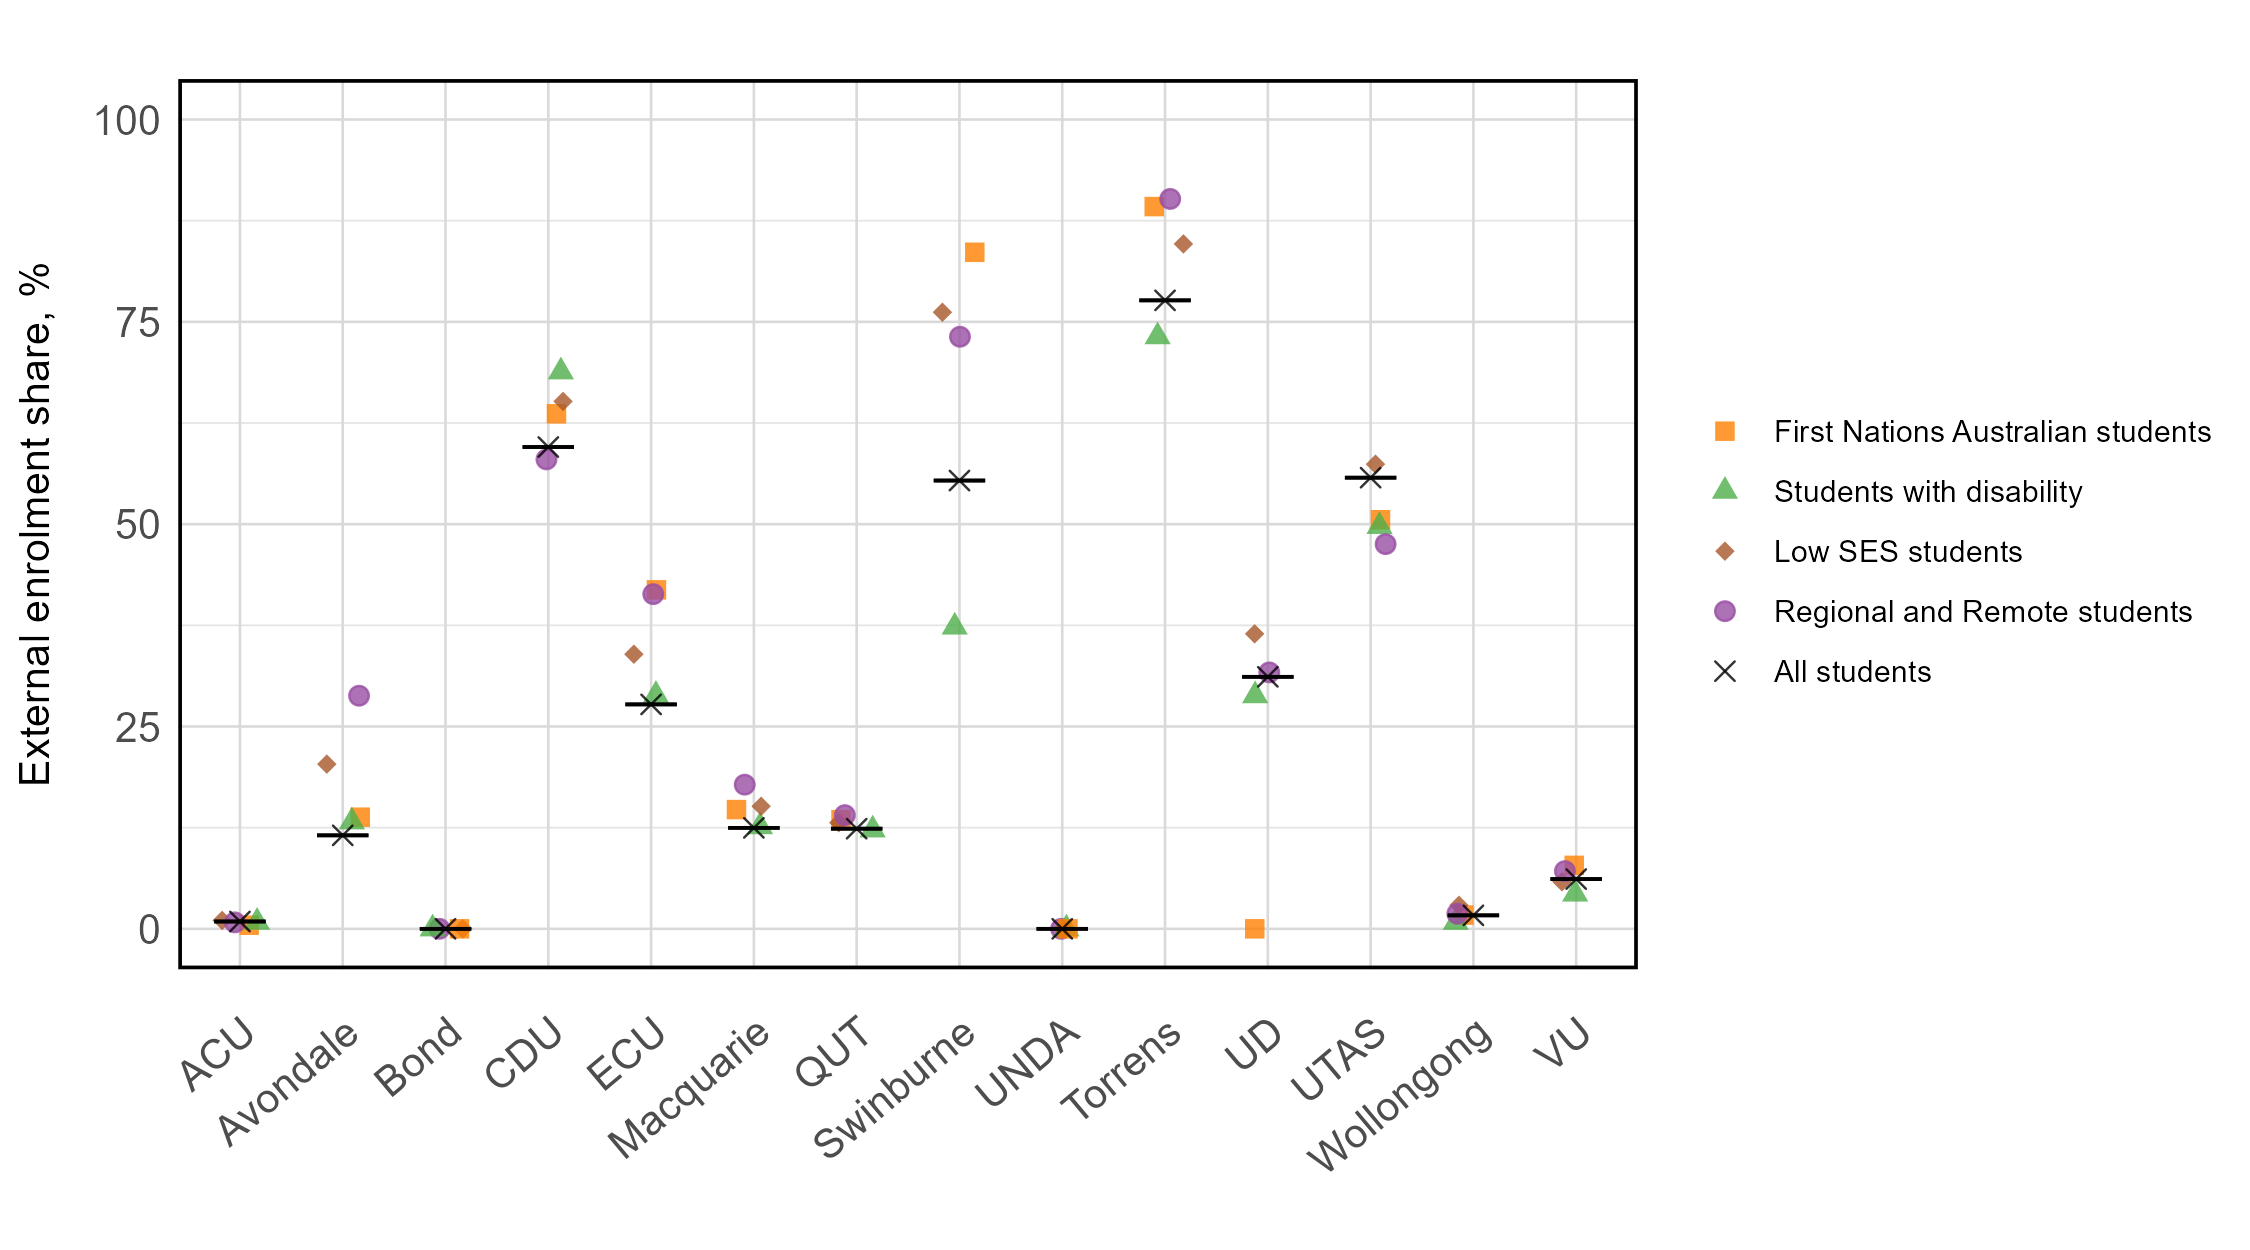
All Group of Eight universities had very low external enrolment shares
Figure 9: External student enrolment for each equity group within the Group of Eight universities. The black cross and black line represent the external enrolment share for all students within the university, and the equity group shares are presented as coloured. shapes.
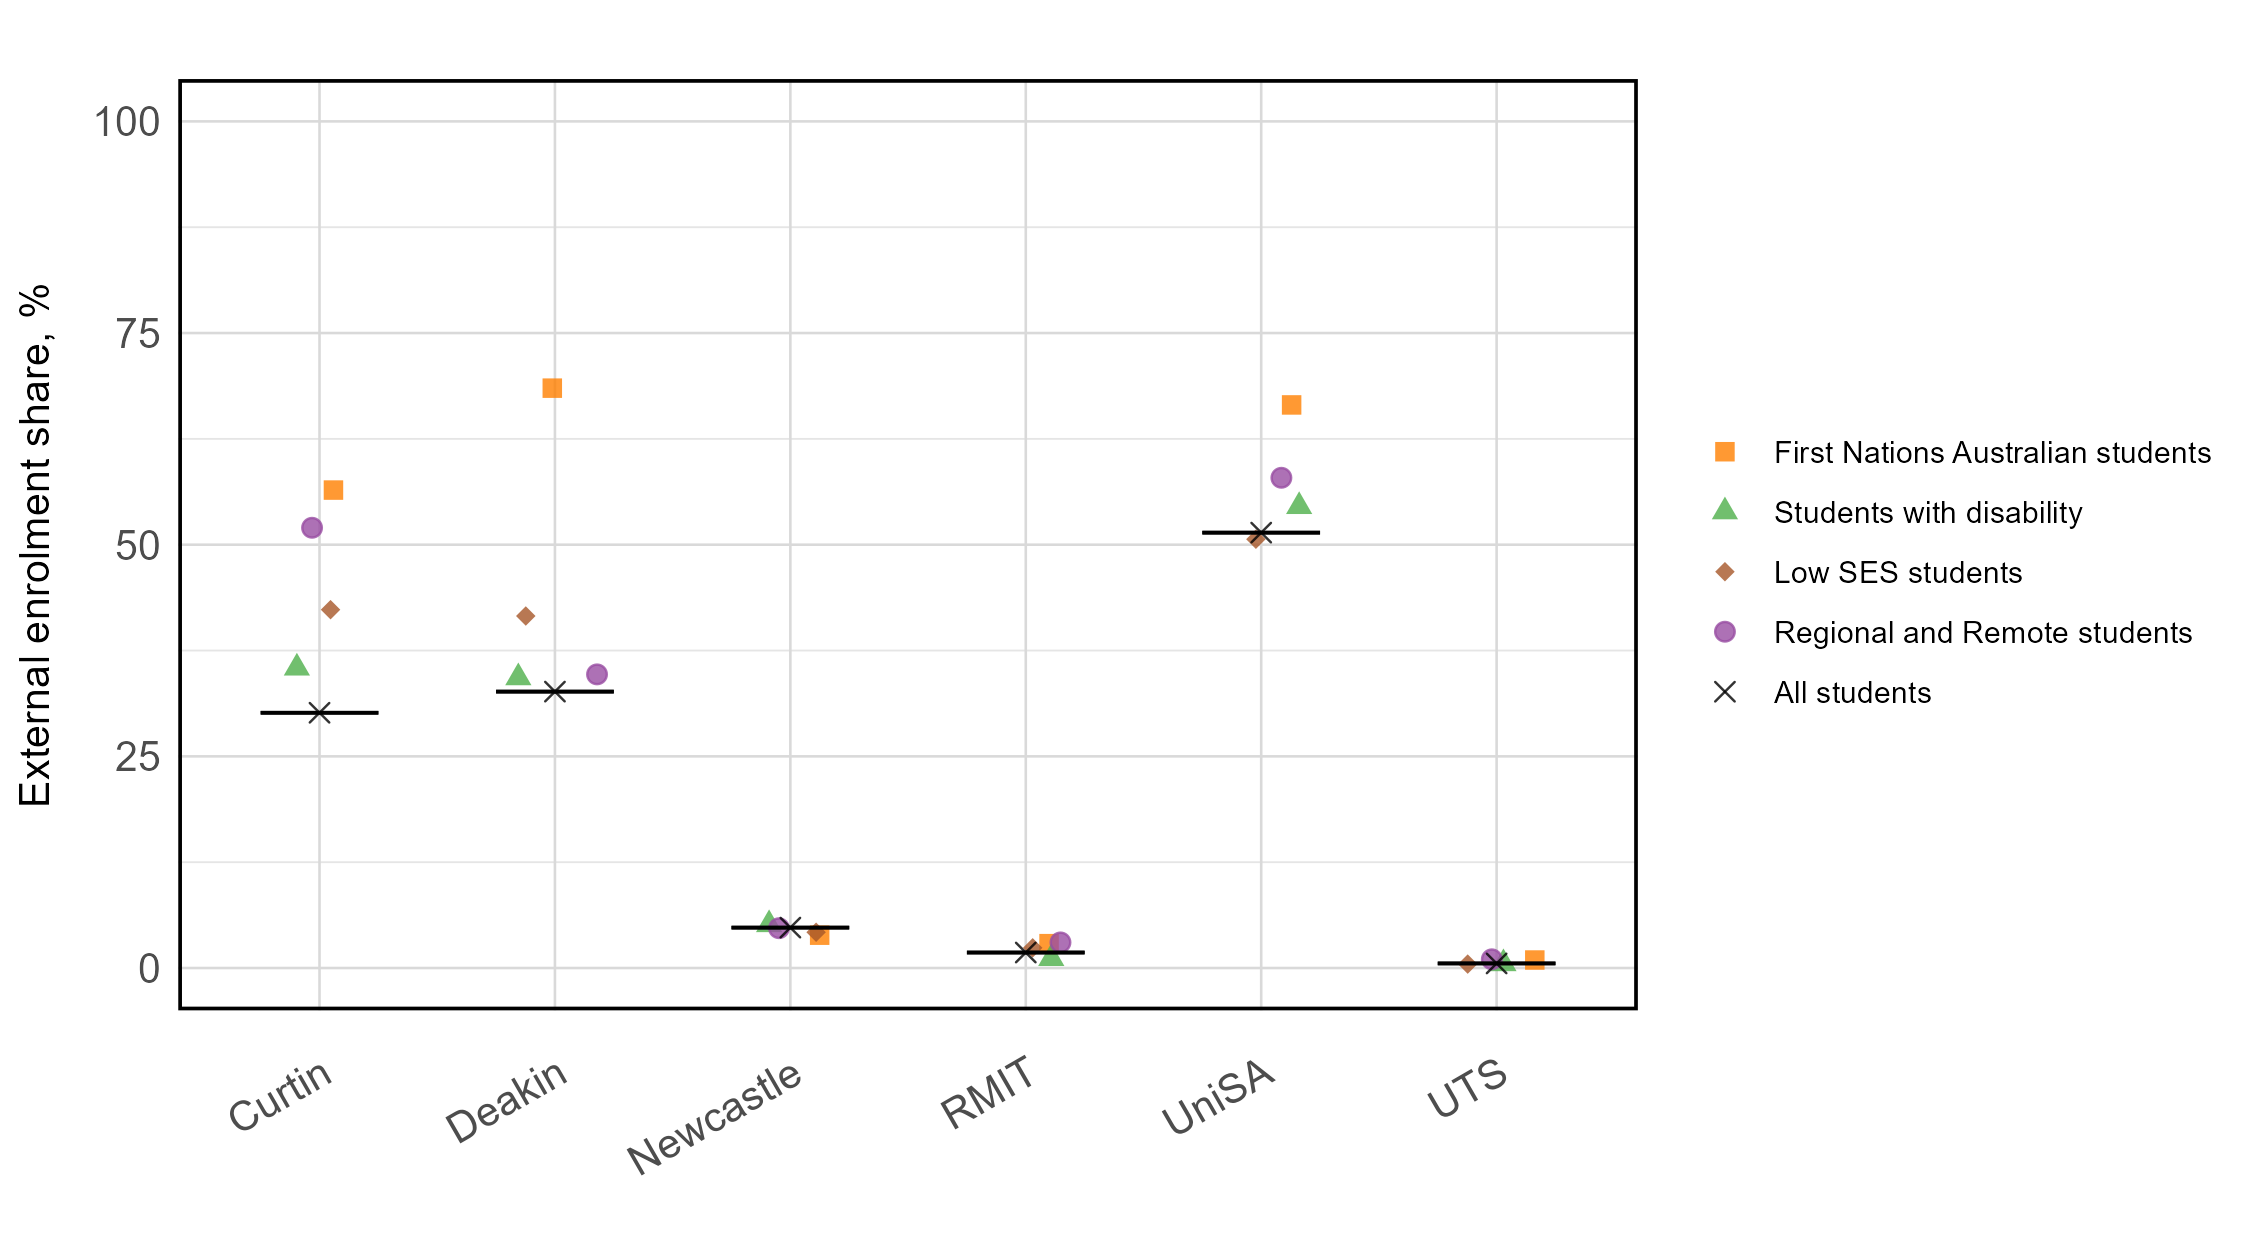
Australian Technology Network universities showed substantial variation in external enrolment shares across institutions, with all equity groups generally having higher external enrolment
Figure 10: External enrolment shares for each equity group within the Australian Technology Network universities. The black cross and black line represent the external enrolment share for all students within the university, and the equity group shares are presented as coloured shapes.
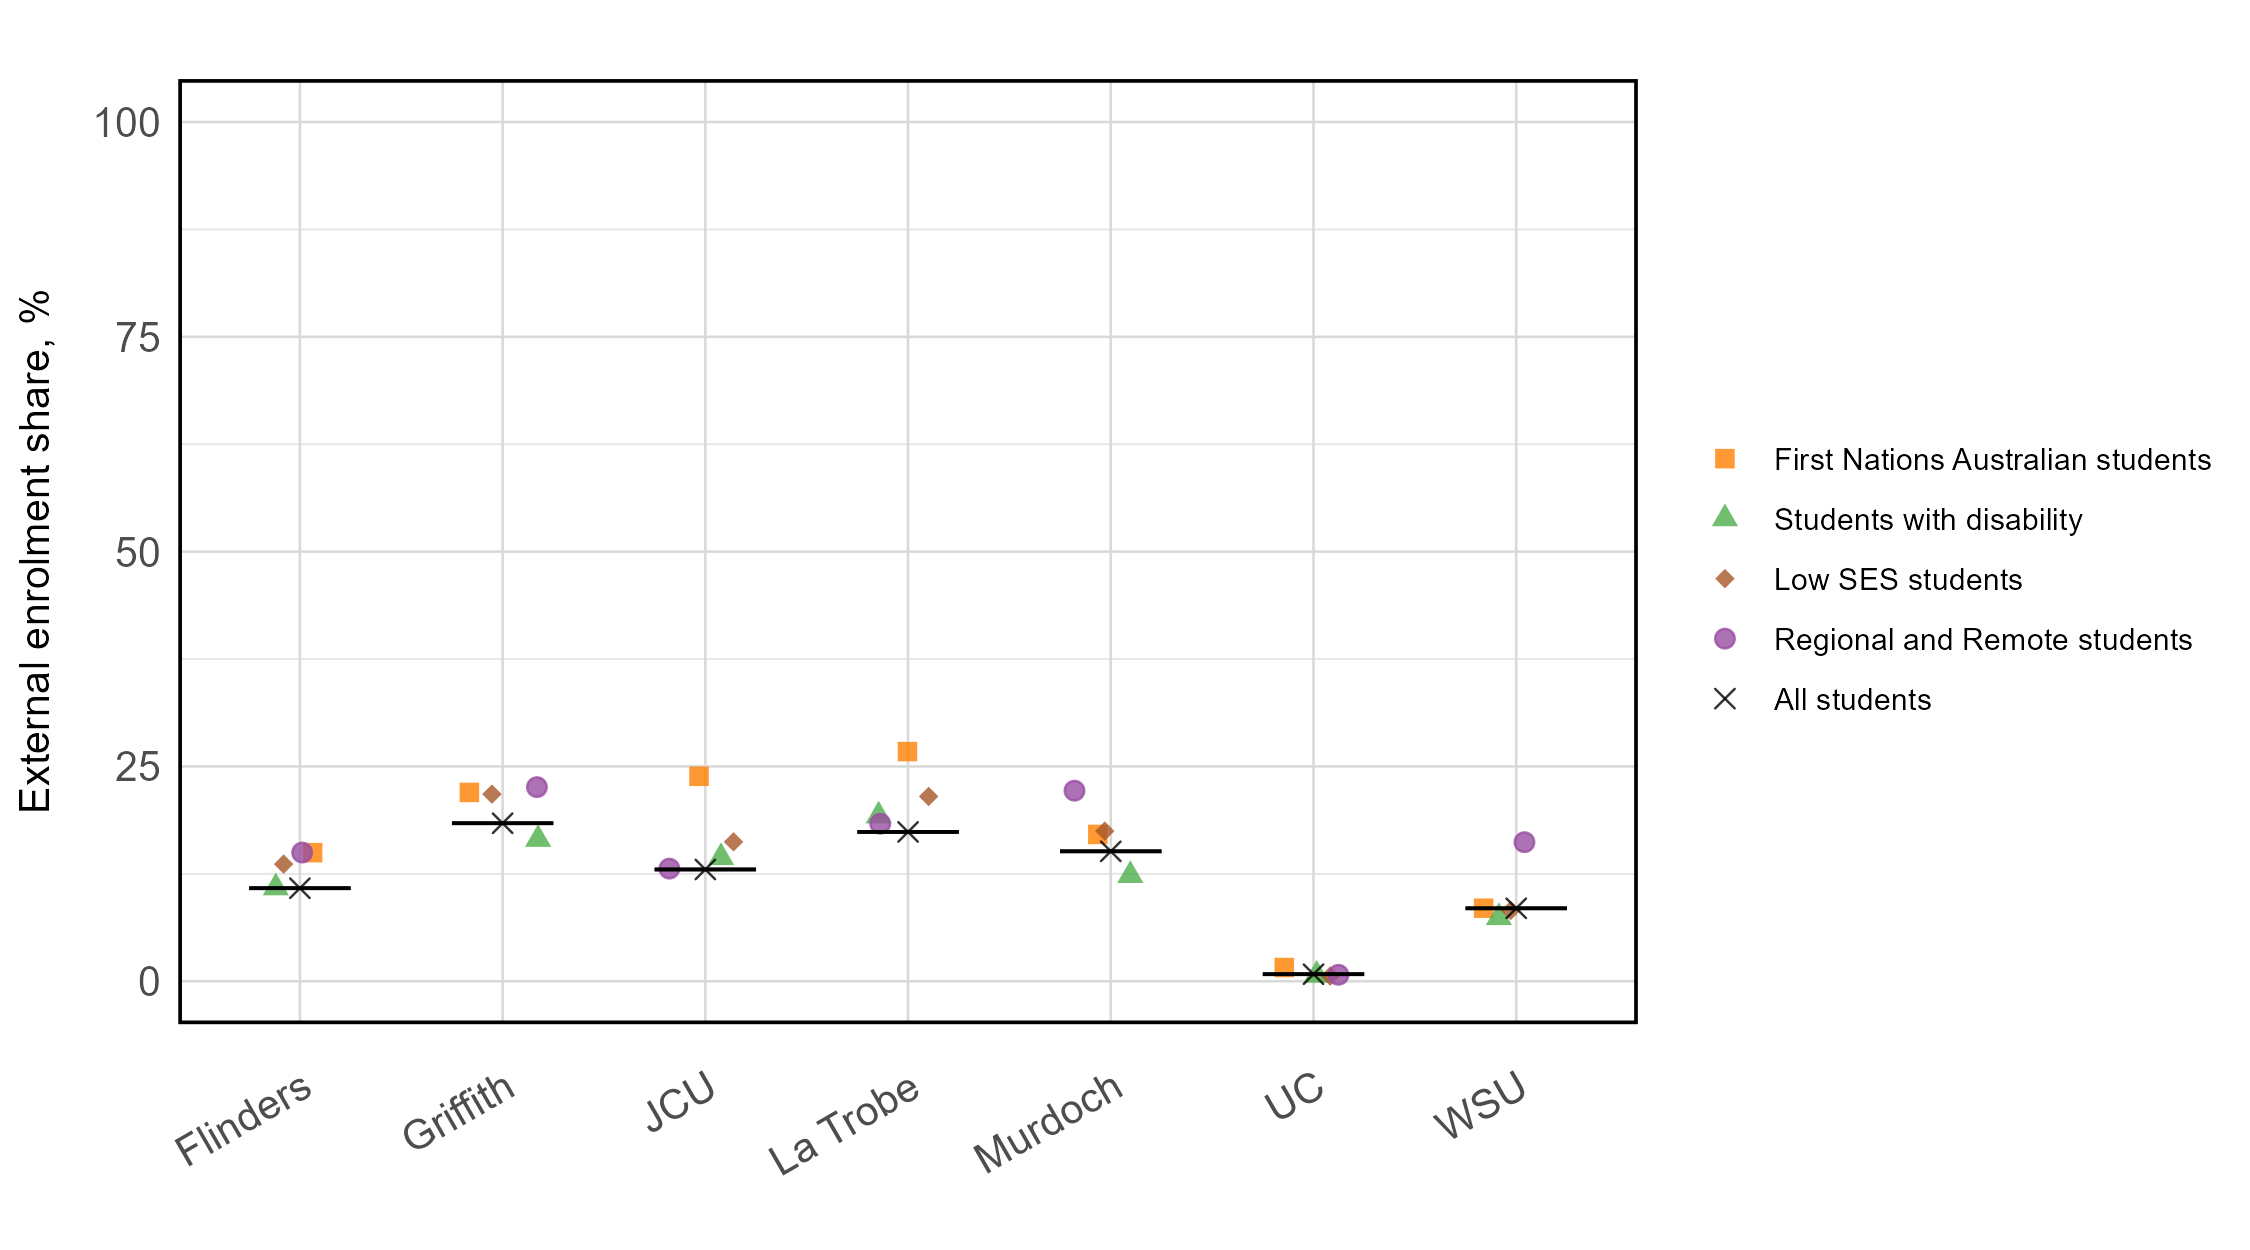
Innovative Research Universities had similar levels of external enrolment, with equity groups having higher external enrolment
Figure 11: External enrolment shares for each equity group within the Innovative Research Universities. The black cross and black line represent the external enrolment share for all students within the university, and the equity group shares are presented as coloured shapes.
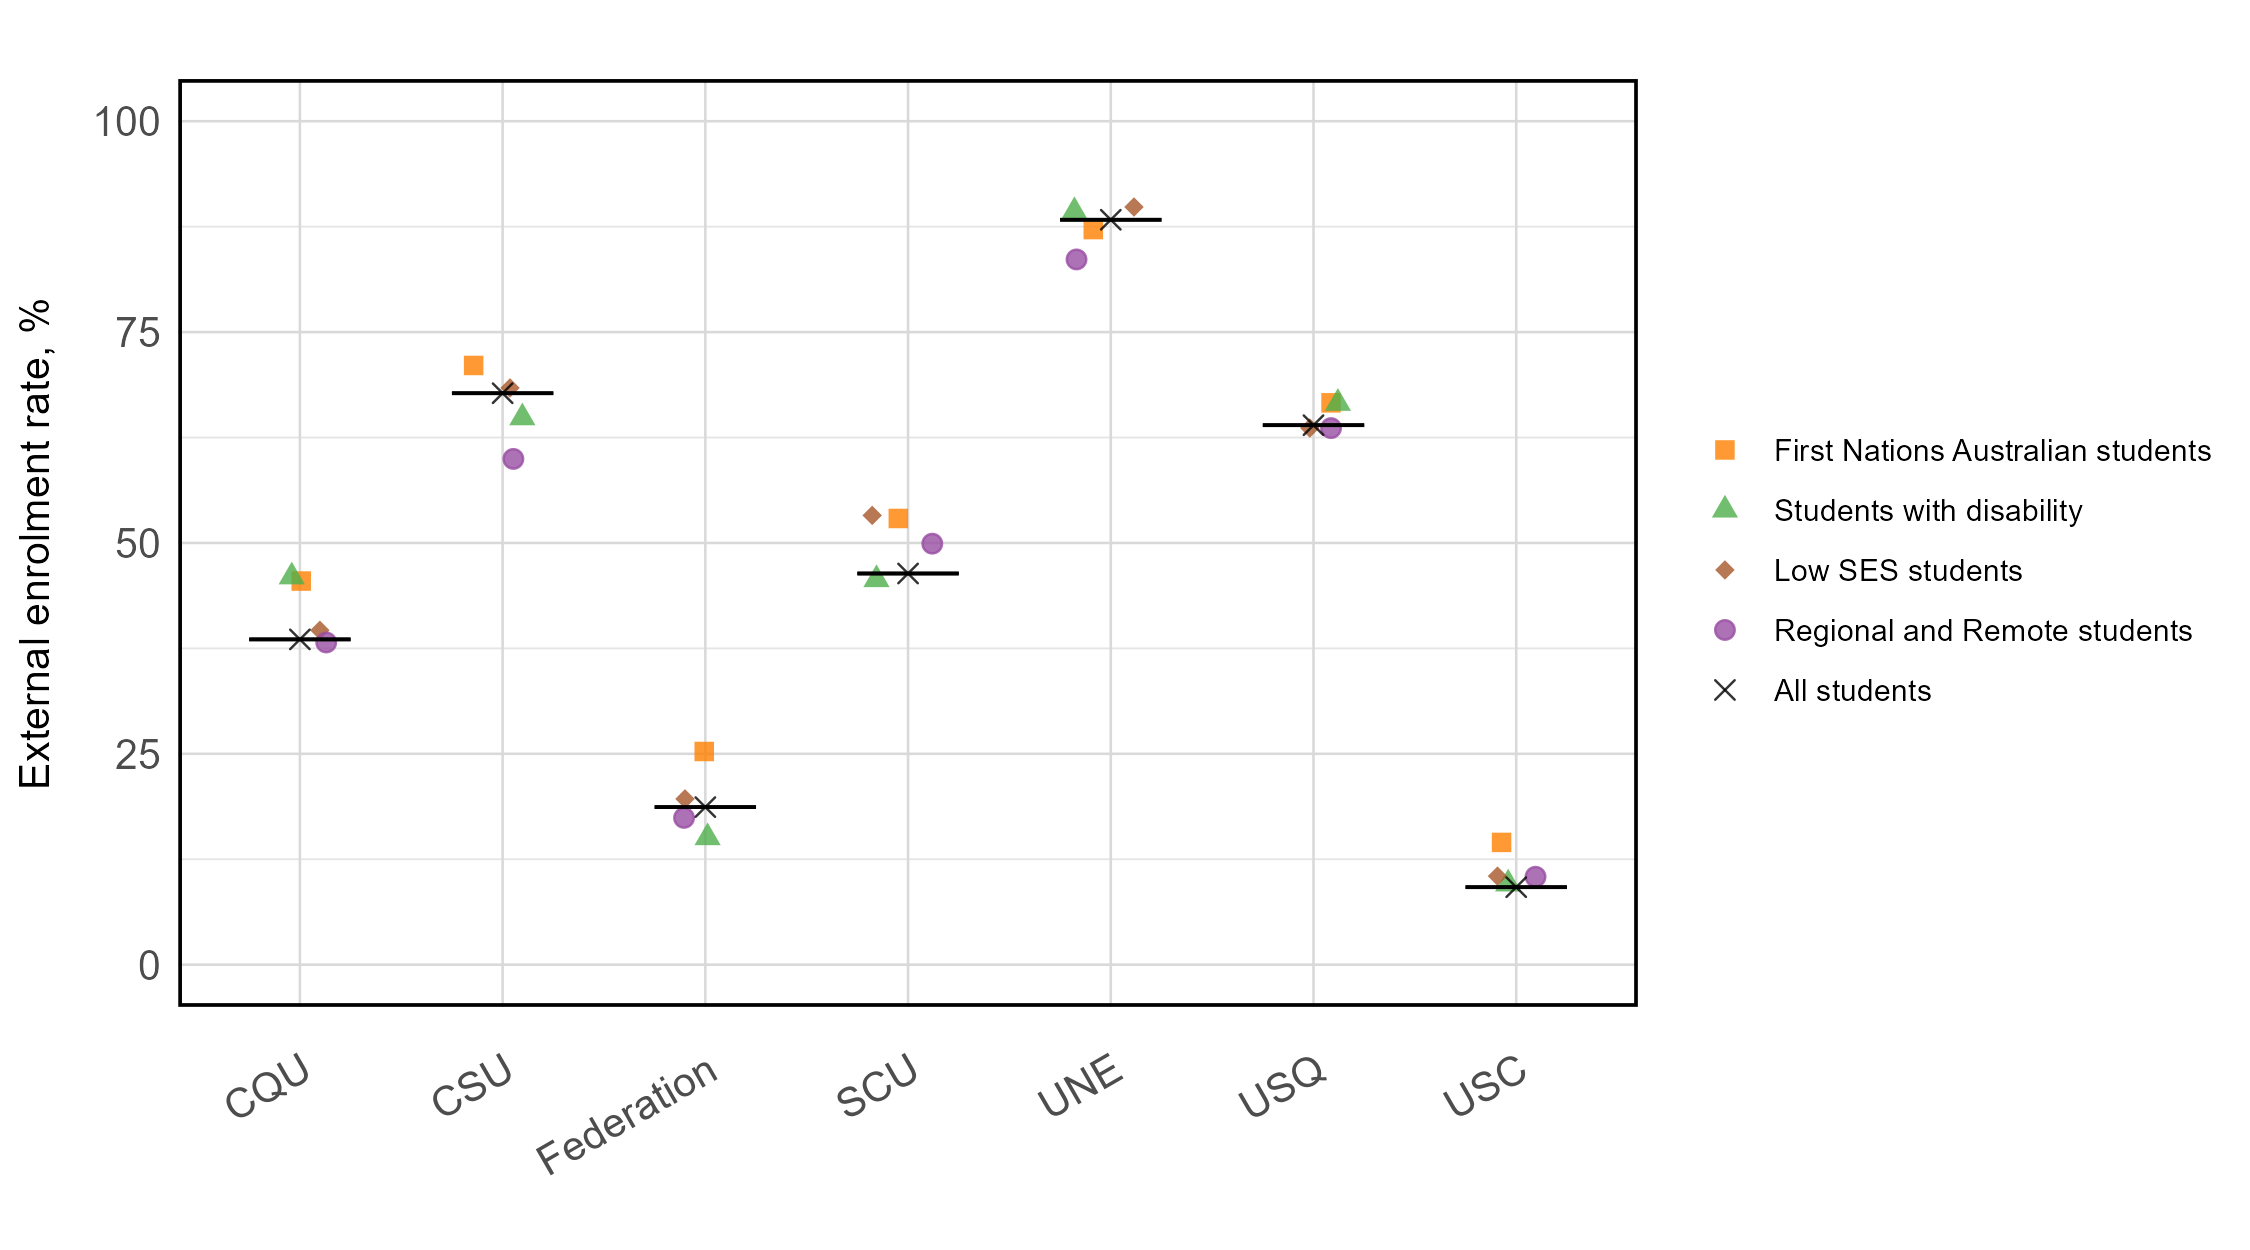
Within the Regional University Network, there was substantial variation in external enrolment shares across universities
Figure 12: External enrolment shares for each equity group within the Regional University Network. The black cross and black line represent the external enrolment share for all students within the university, and the equity group shares are presented as coloured shapes.
Across the non-aligned universities, there was large variation in external enrolment shares
Figure 13: External enrolment shares for each equity group for non-aligned institutions. The black cross and black line represent the external enrolment share for all students within the university, and the equity group shares are presented as coloured shapes.
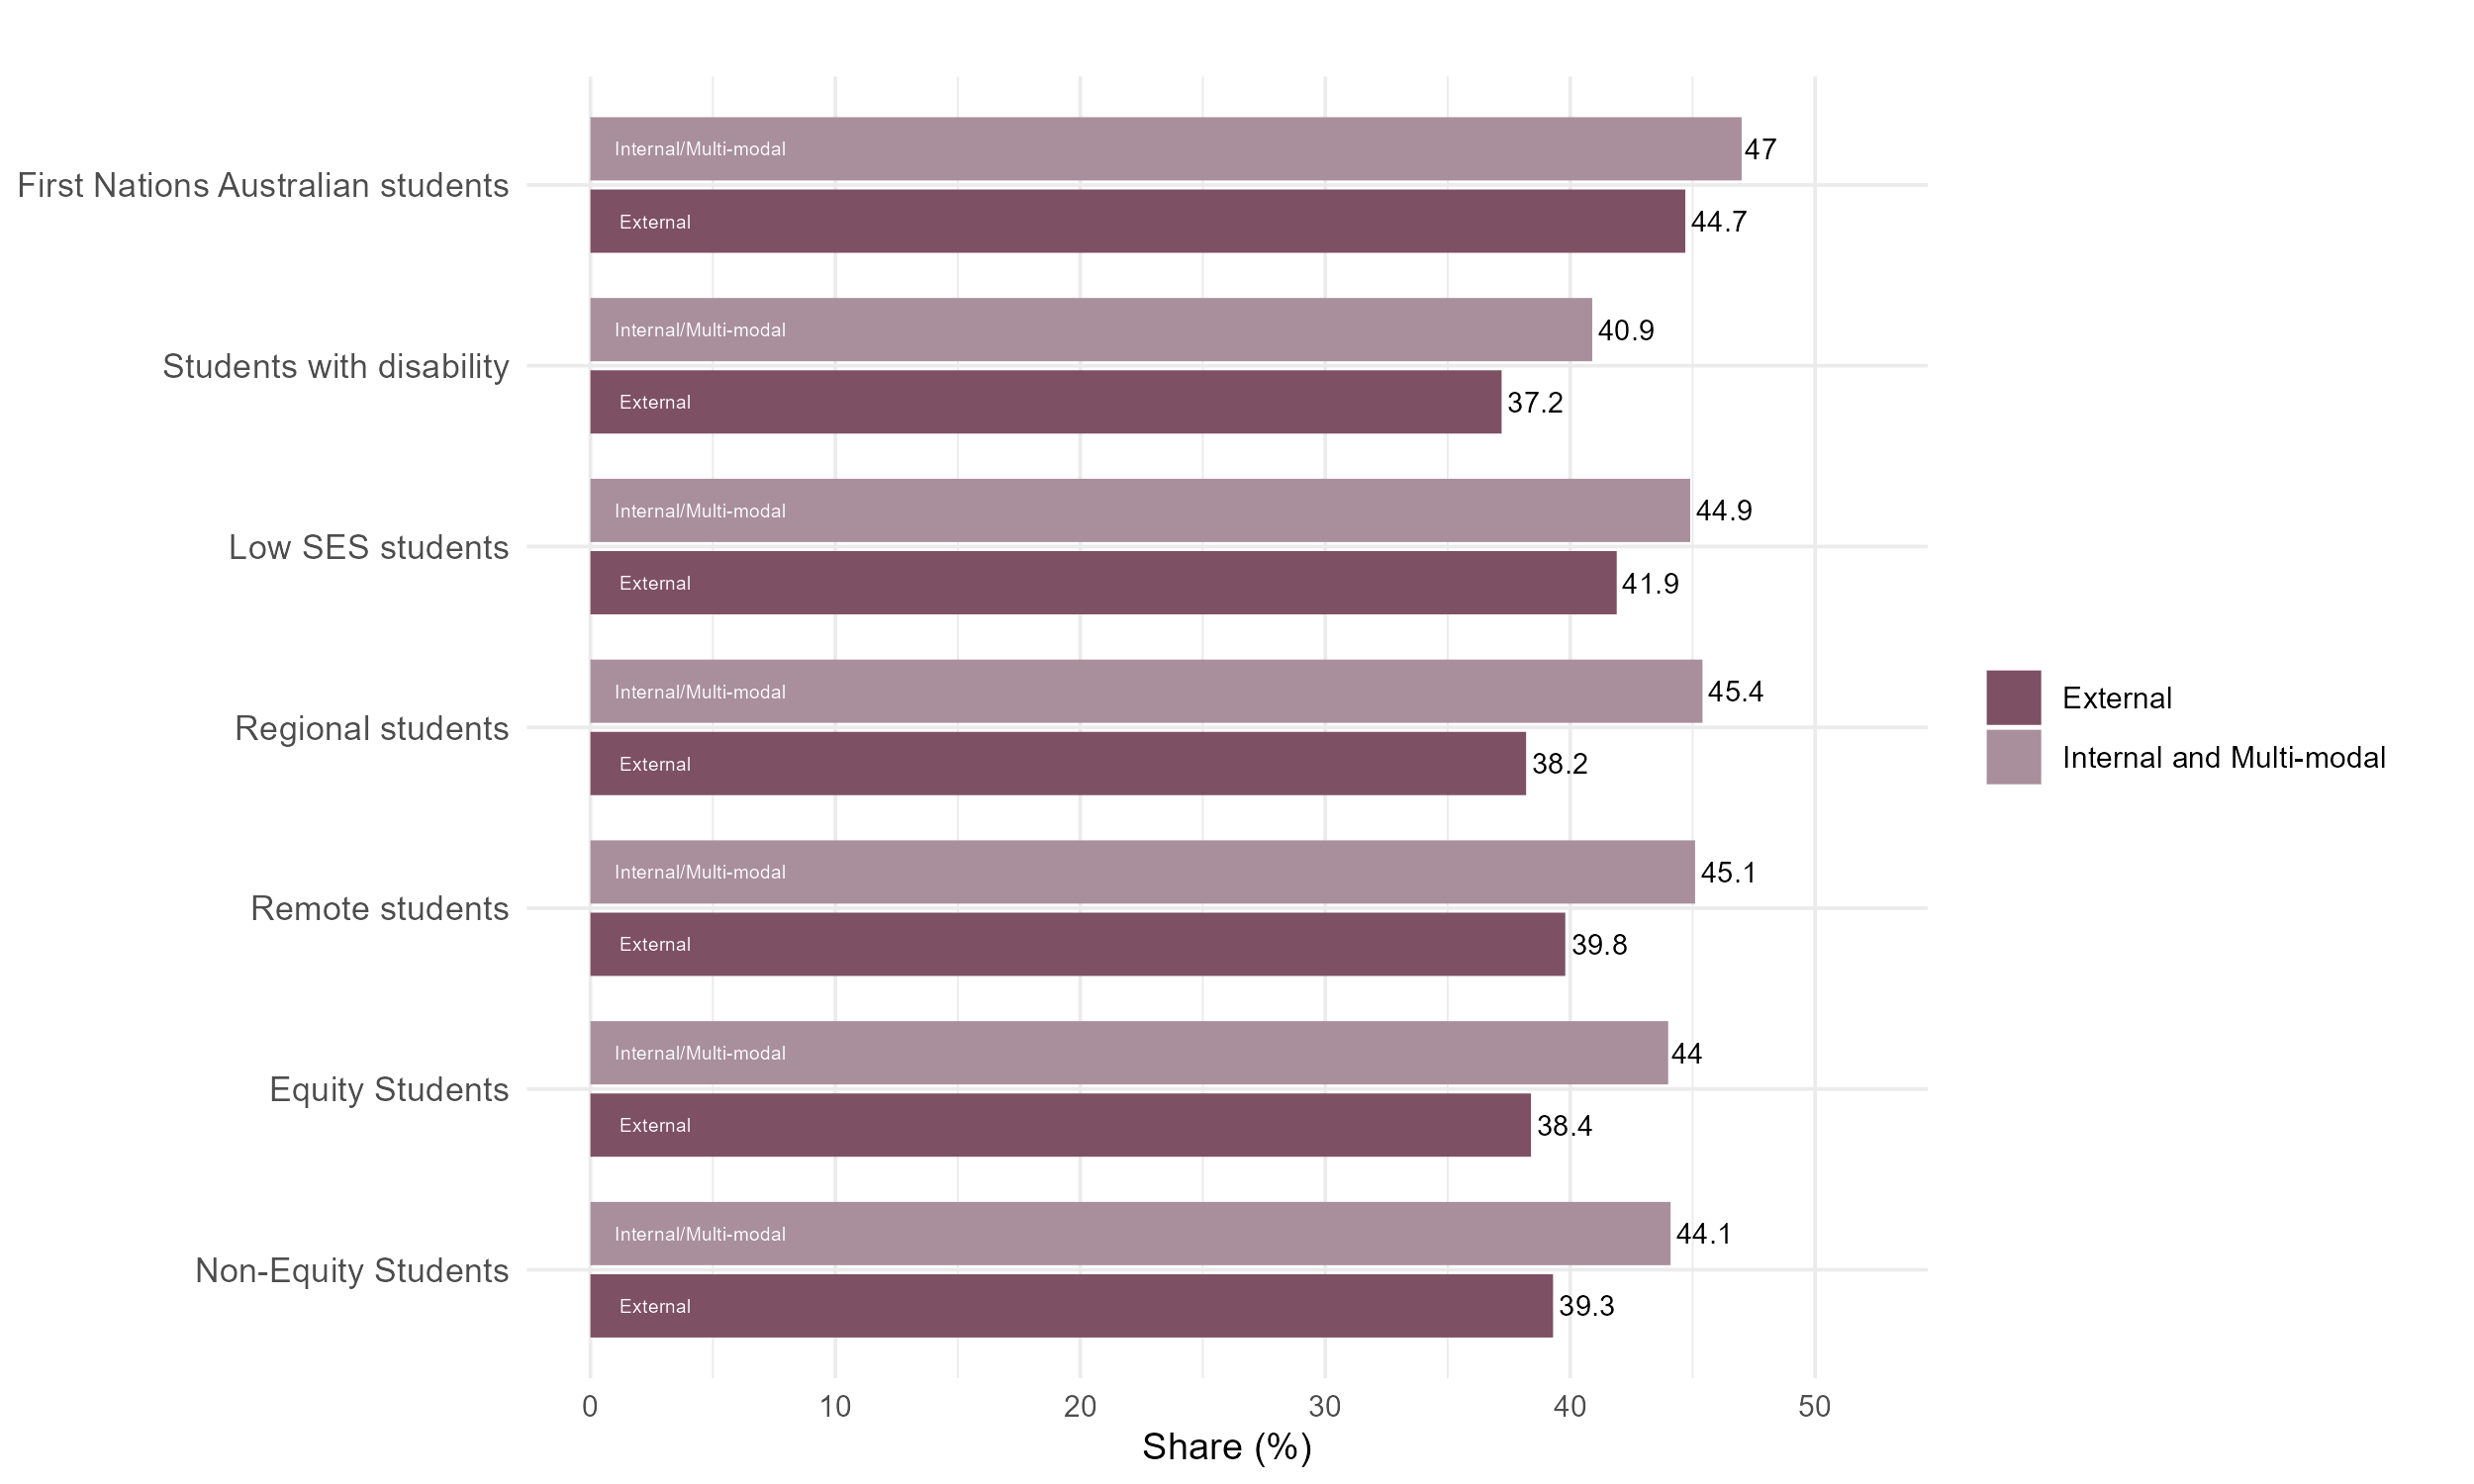
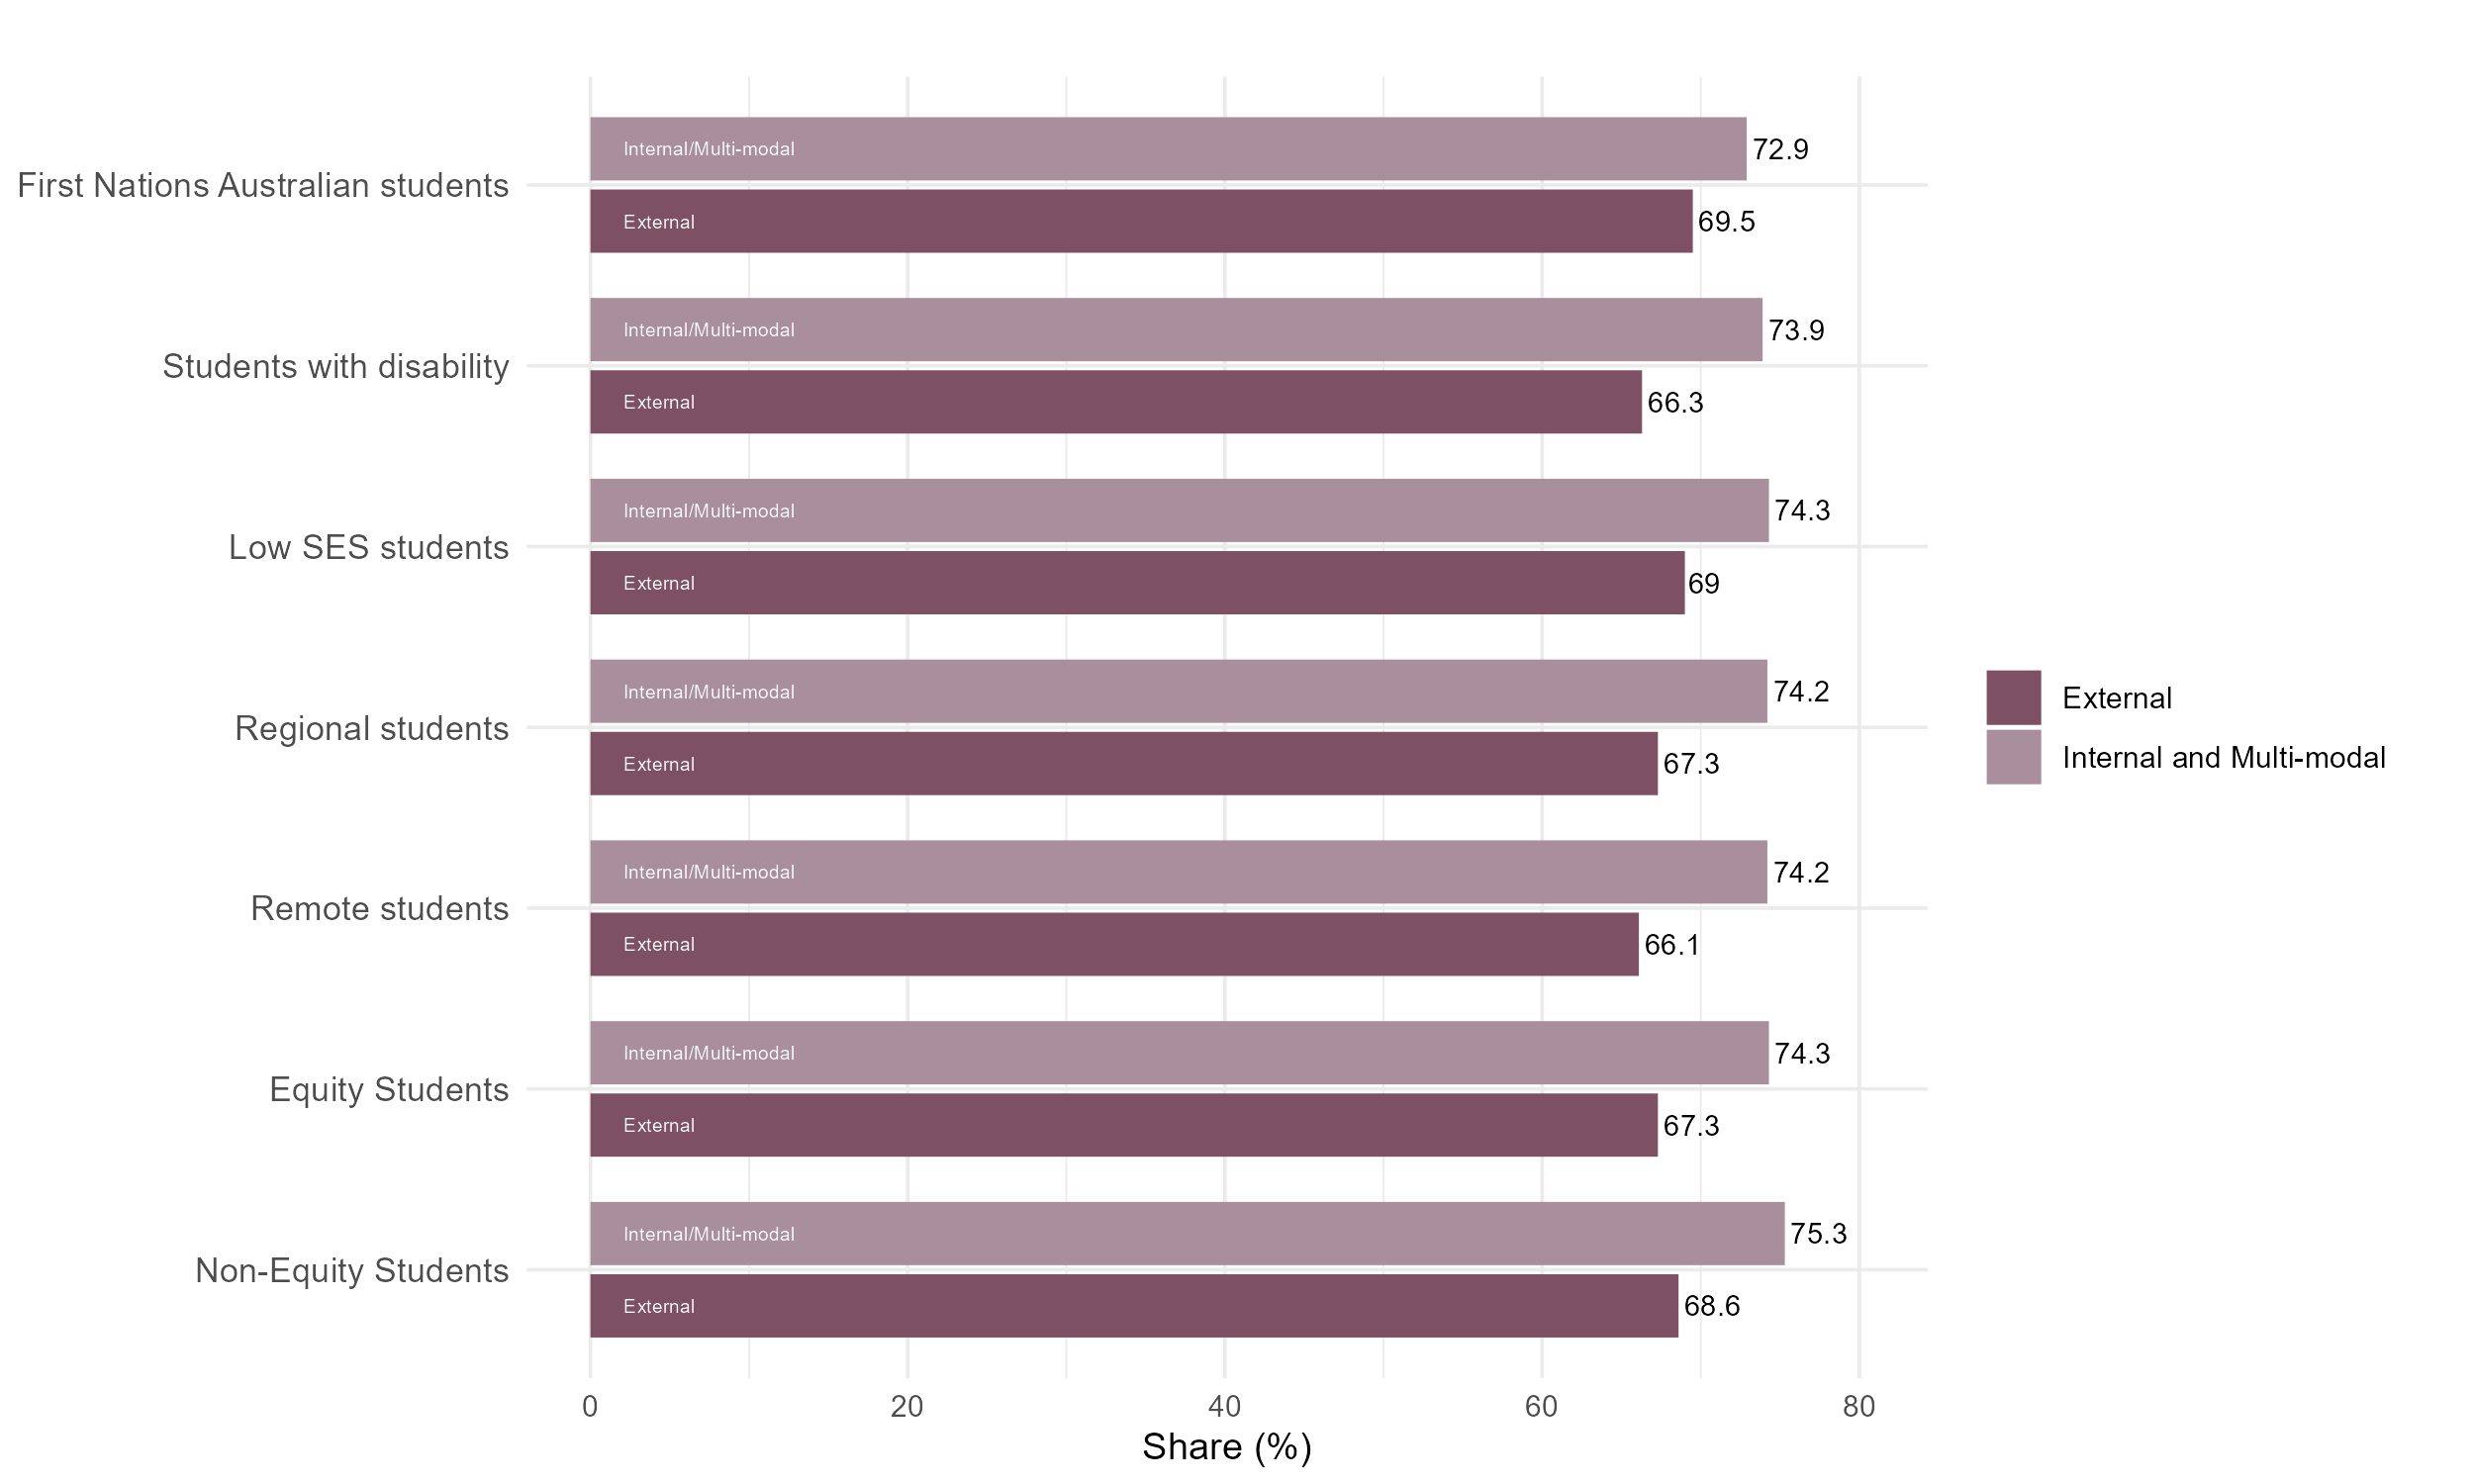
Lower negative impact of finances on study for equity students studying externally
Figure 14: Share of students who stated that their financial circumstances have negatively affected their study, QILT Student Experience Survey, 2023.
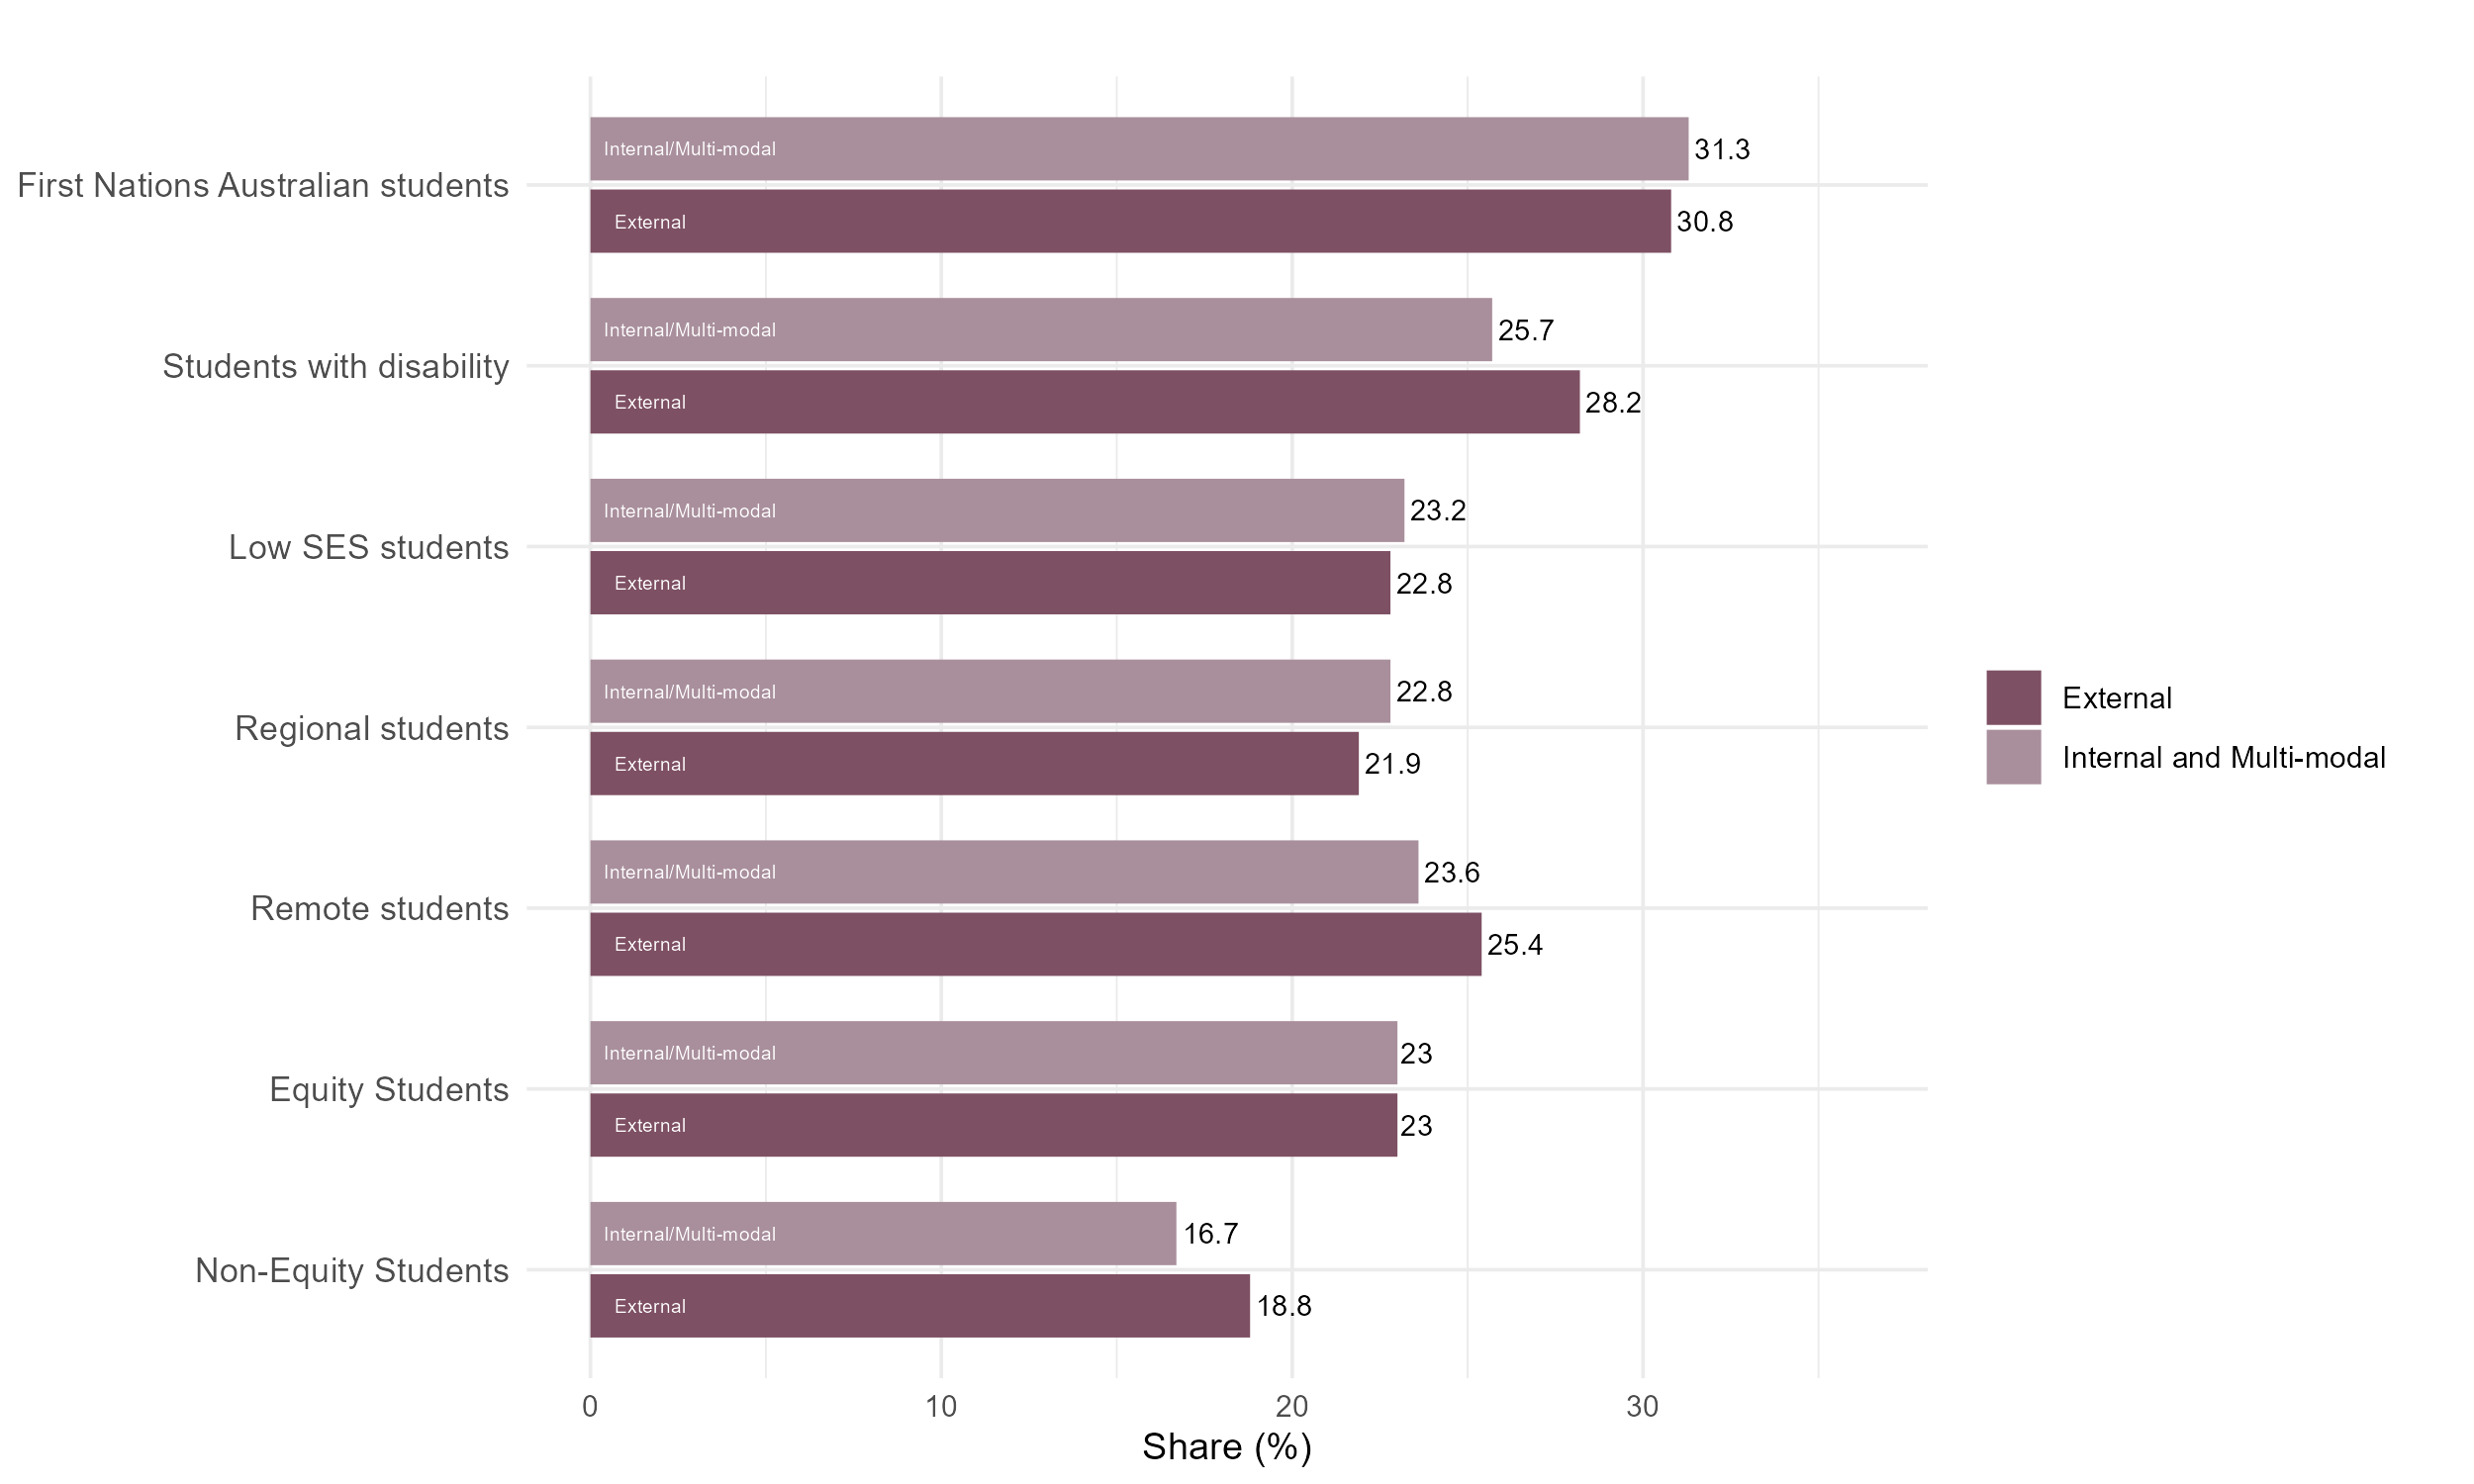
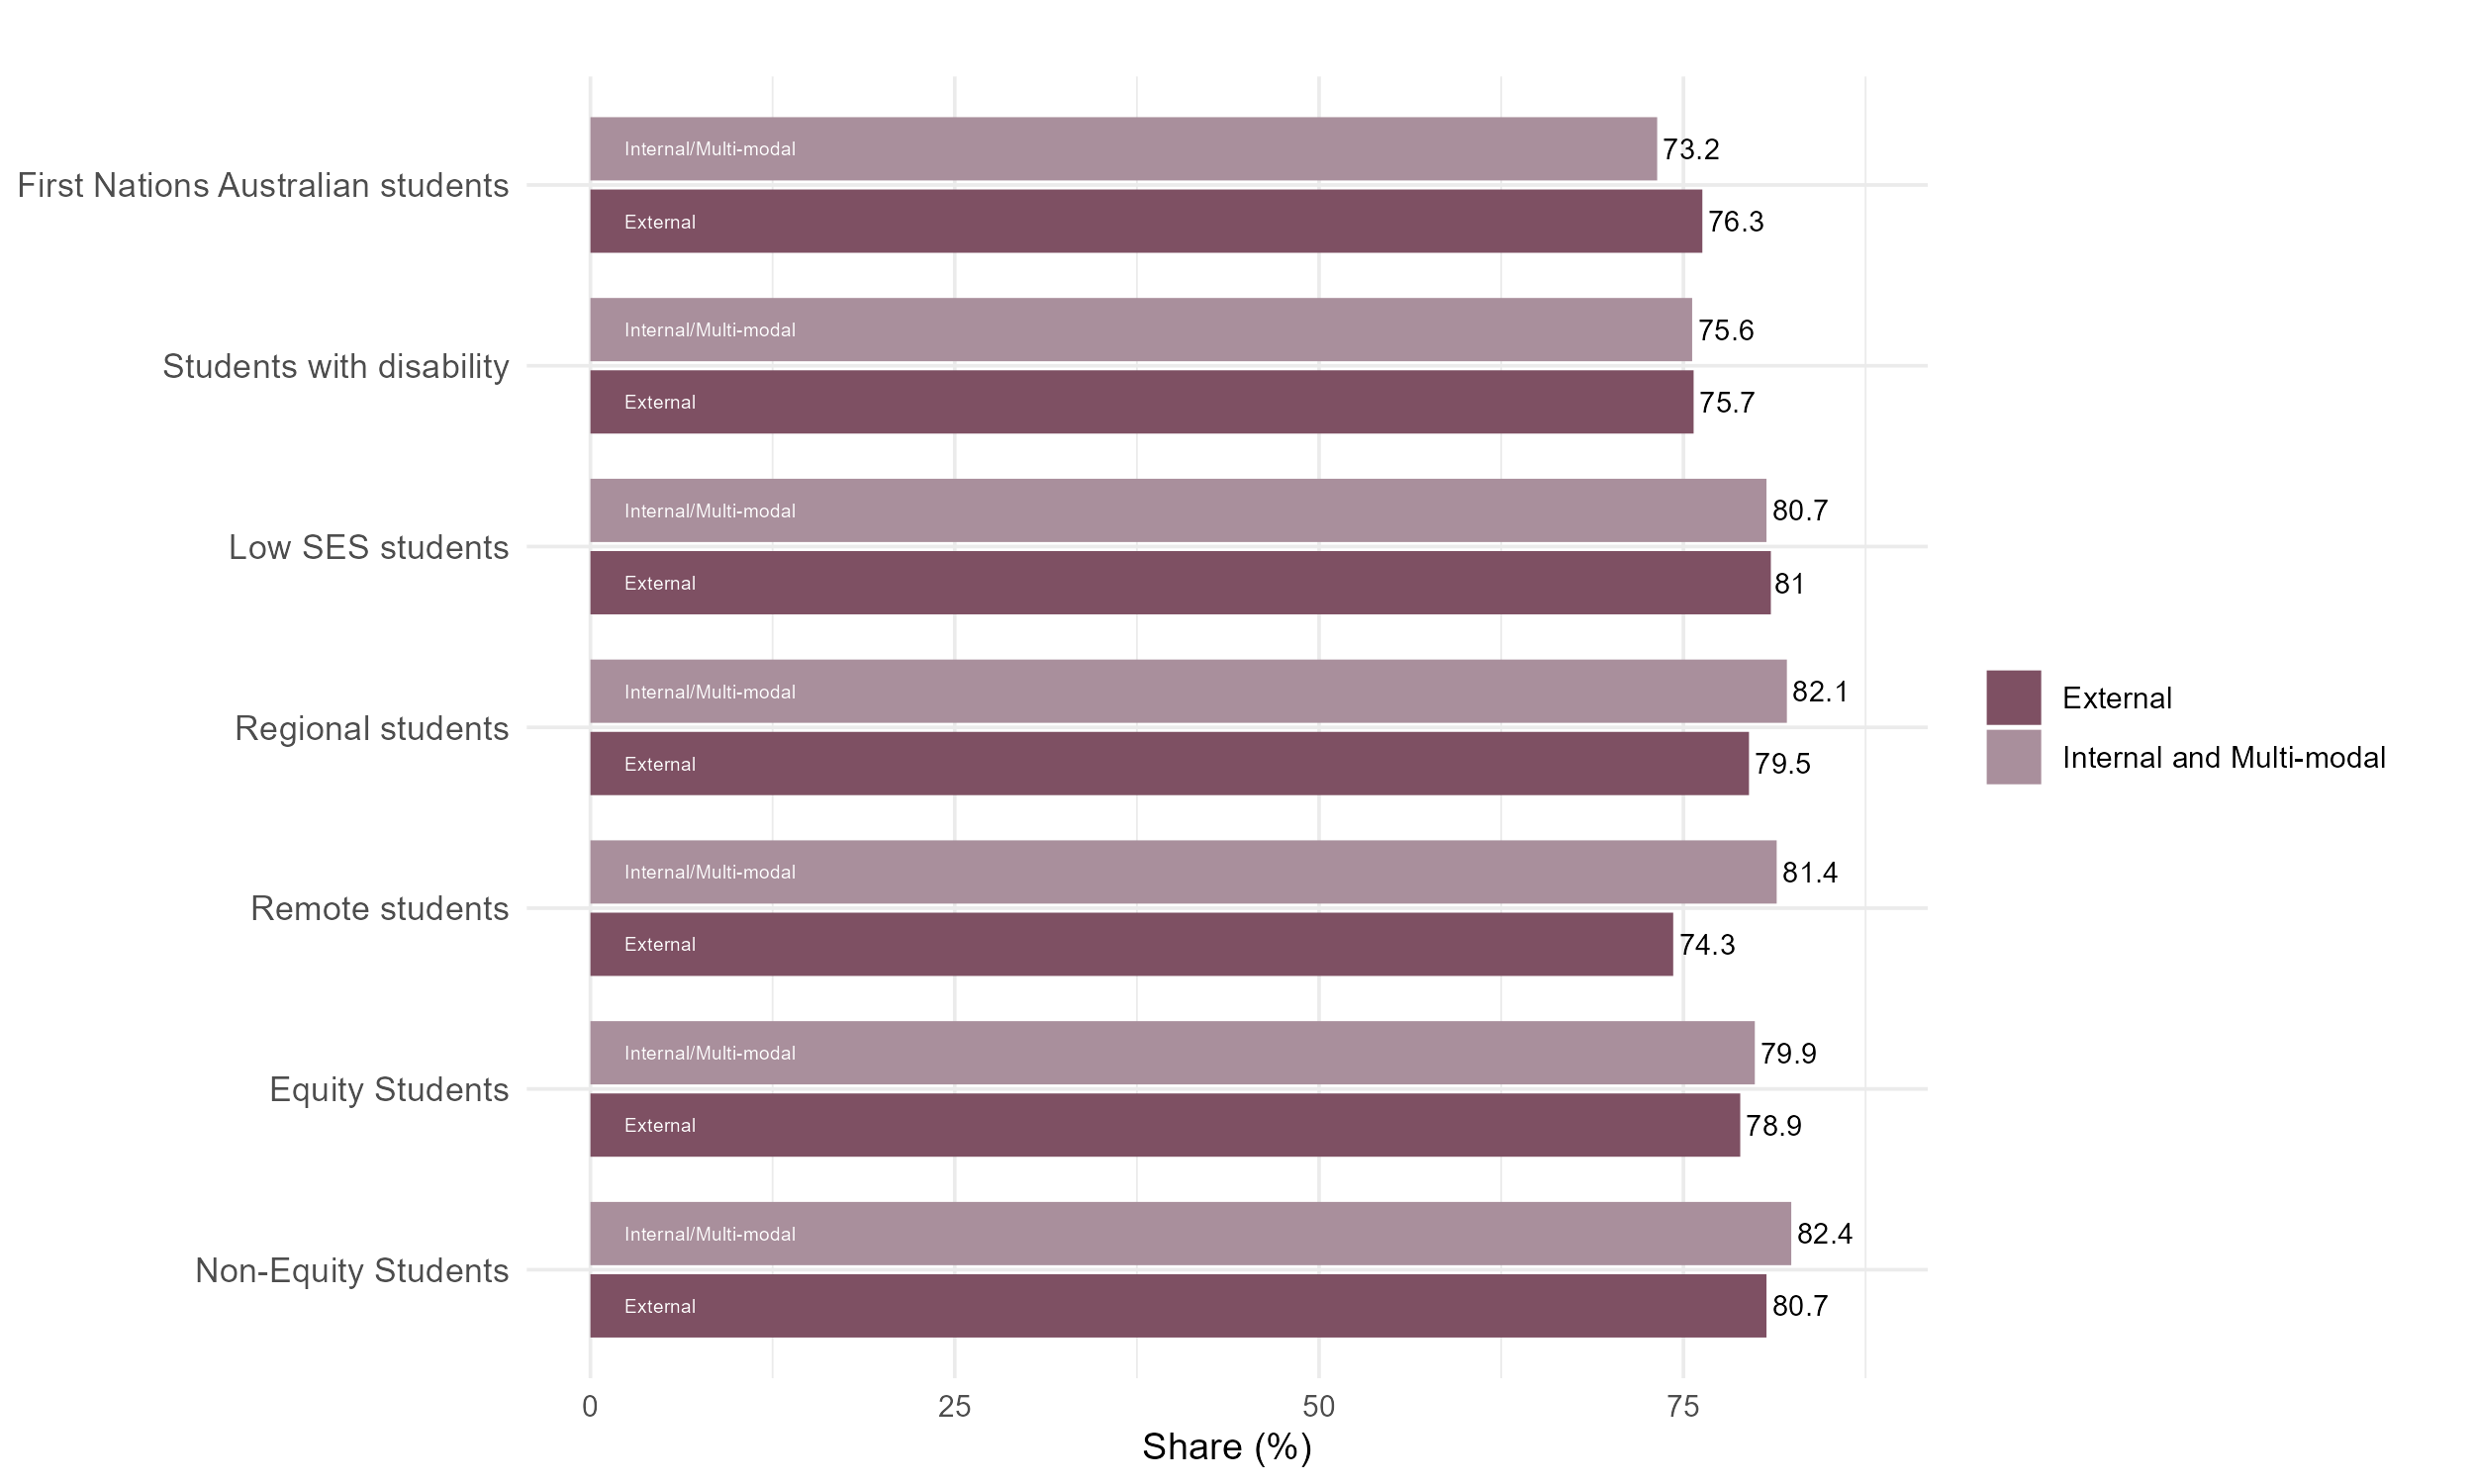
Negative impact of living arrangements on study varies across equity students studying externally
Figure 15: Share of students who stated that their living arrangements have negatively affected their study, QILT Student Experience Survey, 2023.
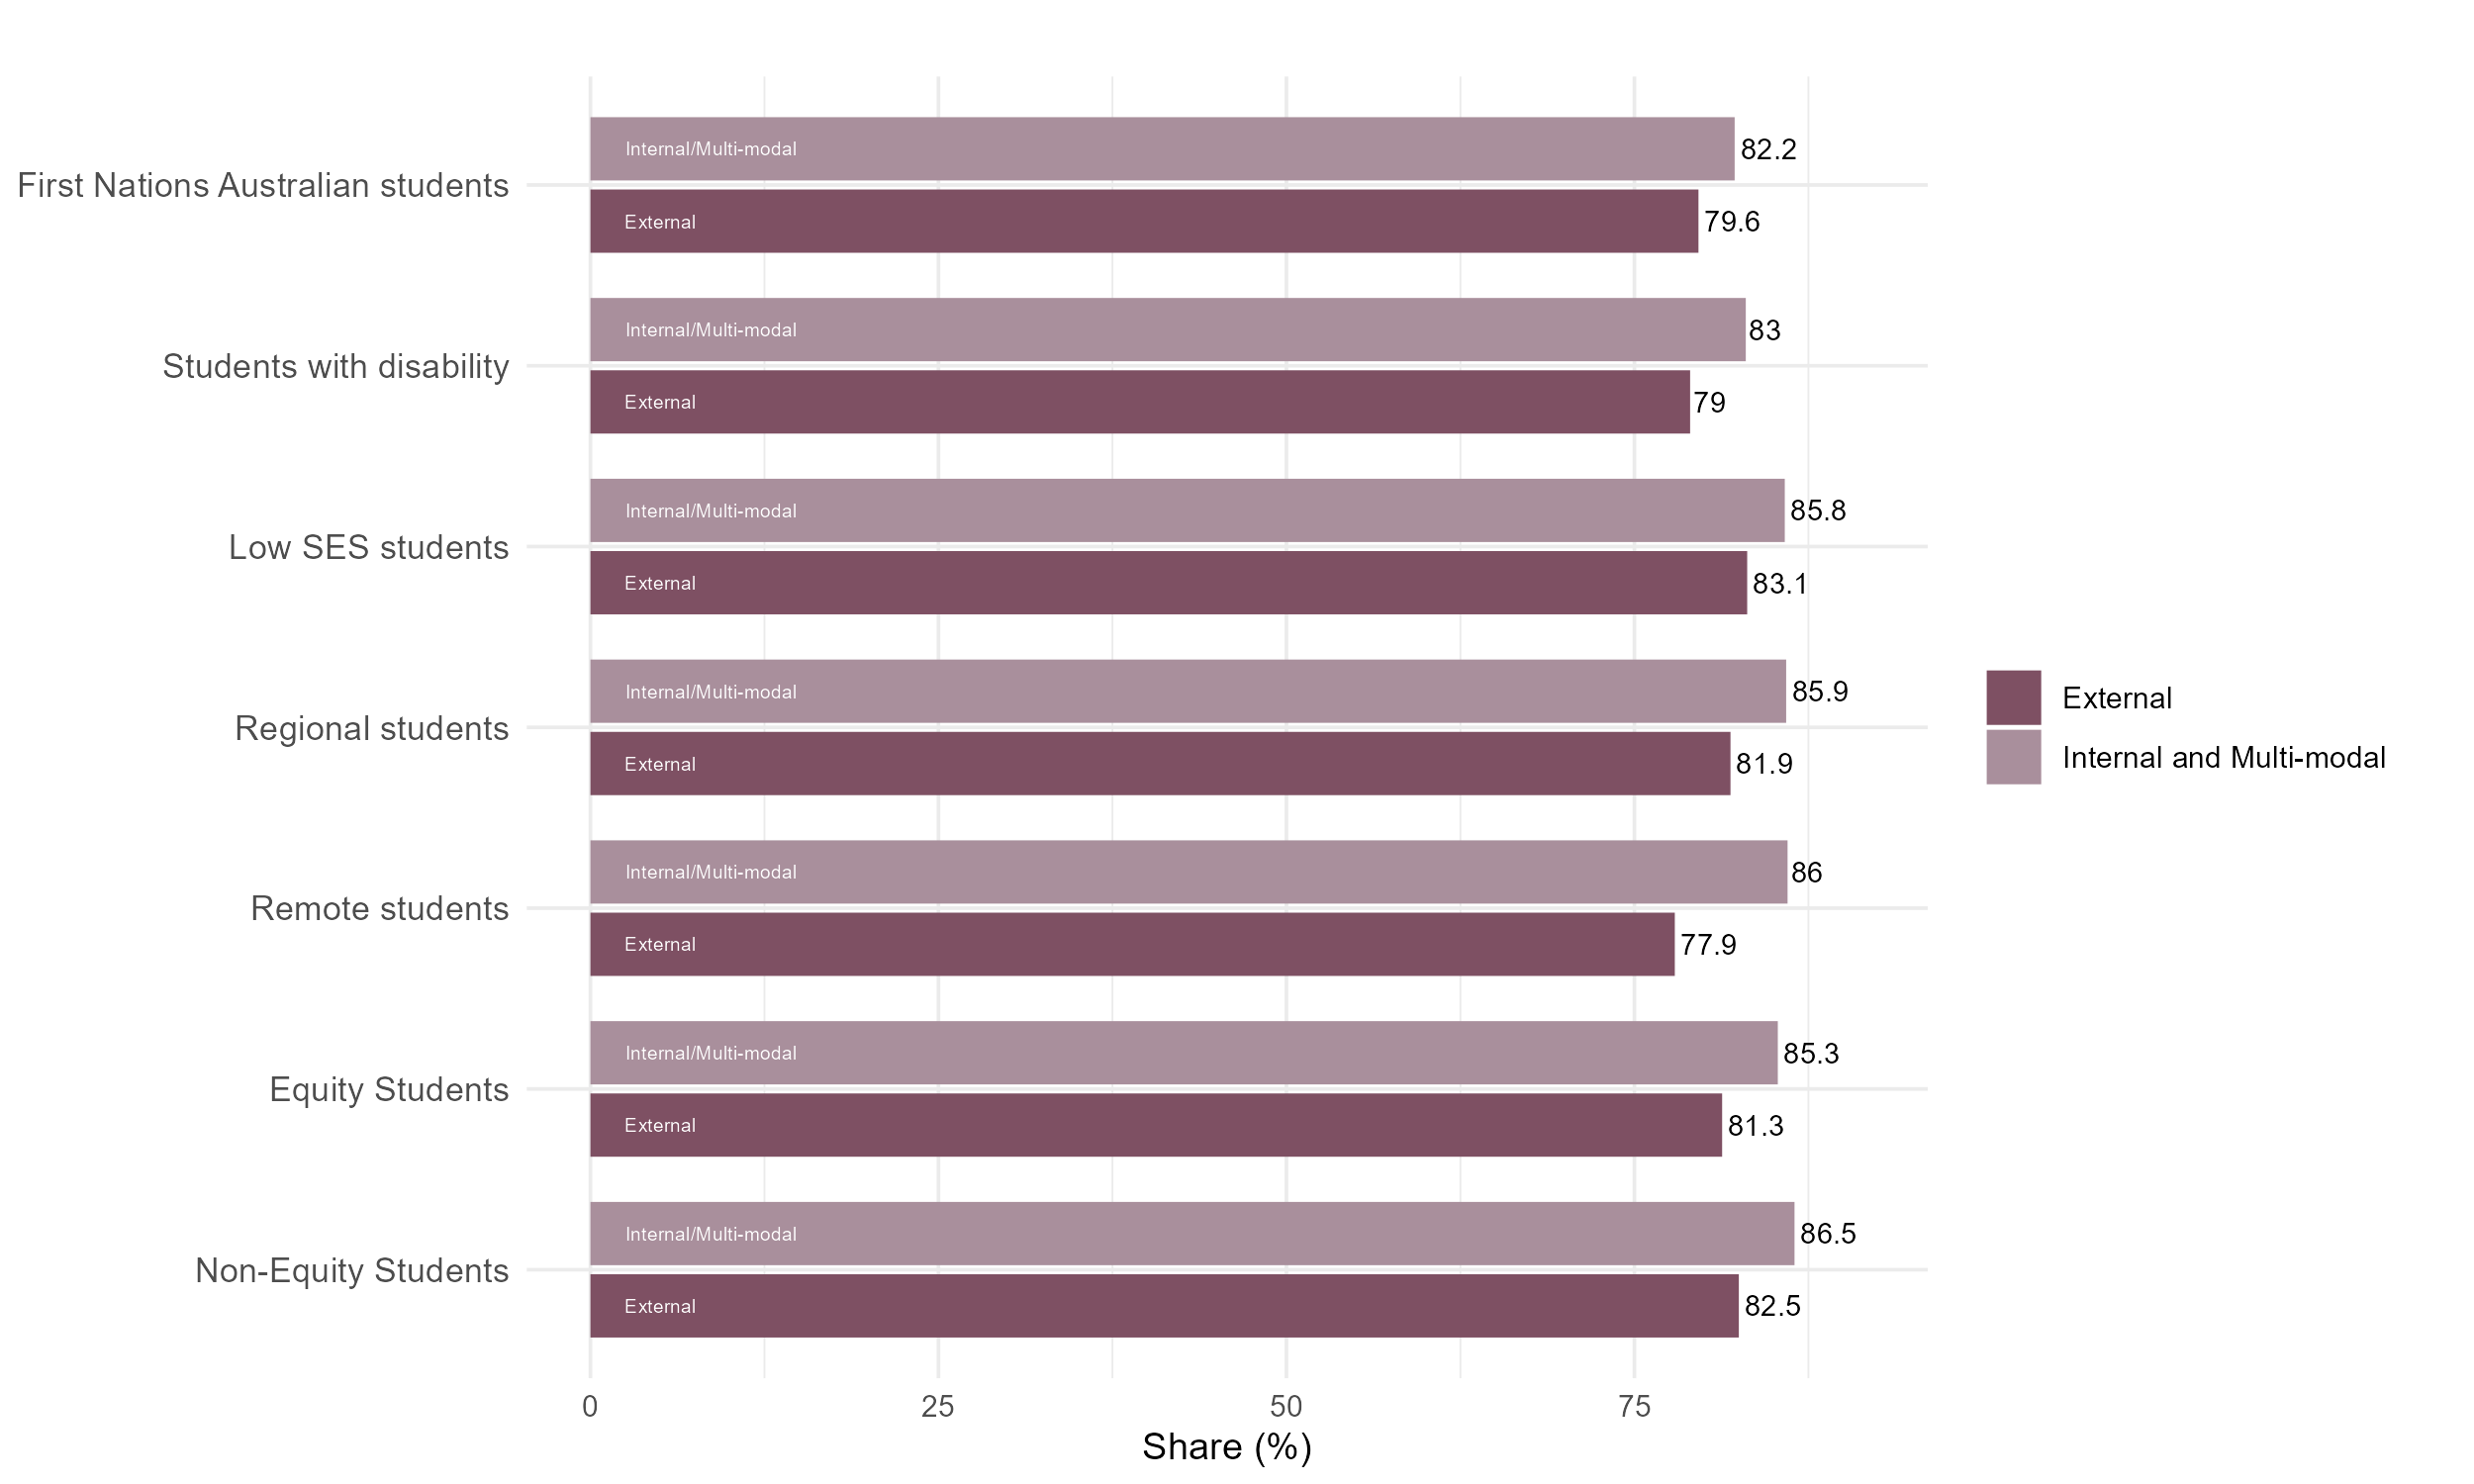
Negative impact of paid work on study is greater for all students studying externally
Figure 16: Share of students who stated that their paid work had negatively affected their study, QILT Student Experience Survey, 2023.
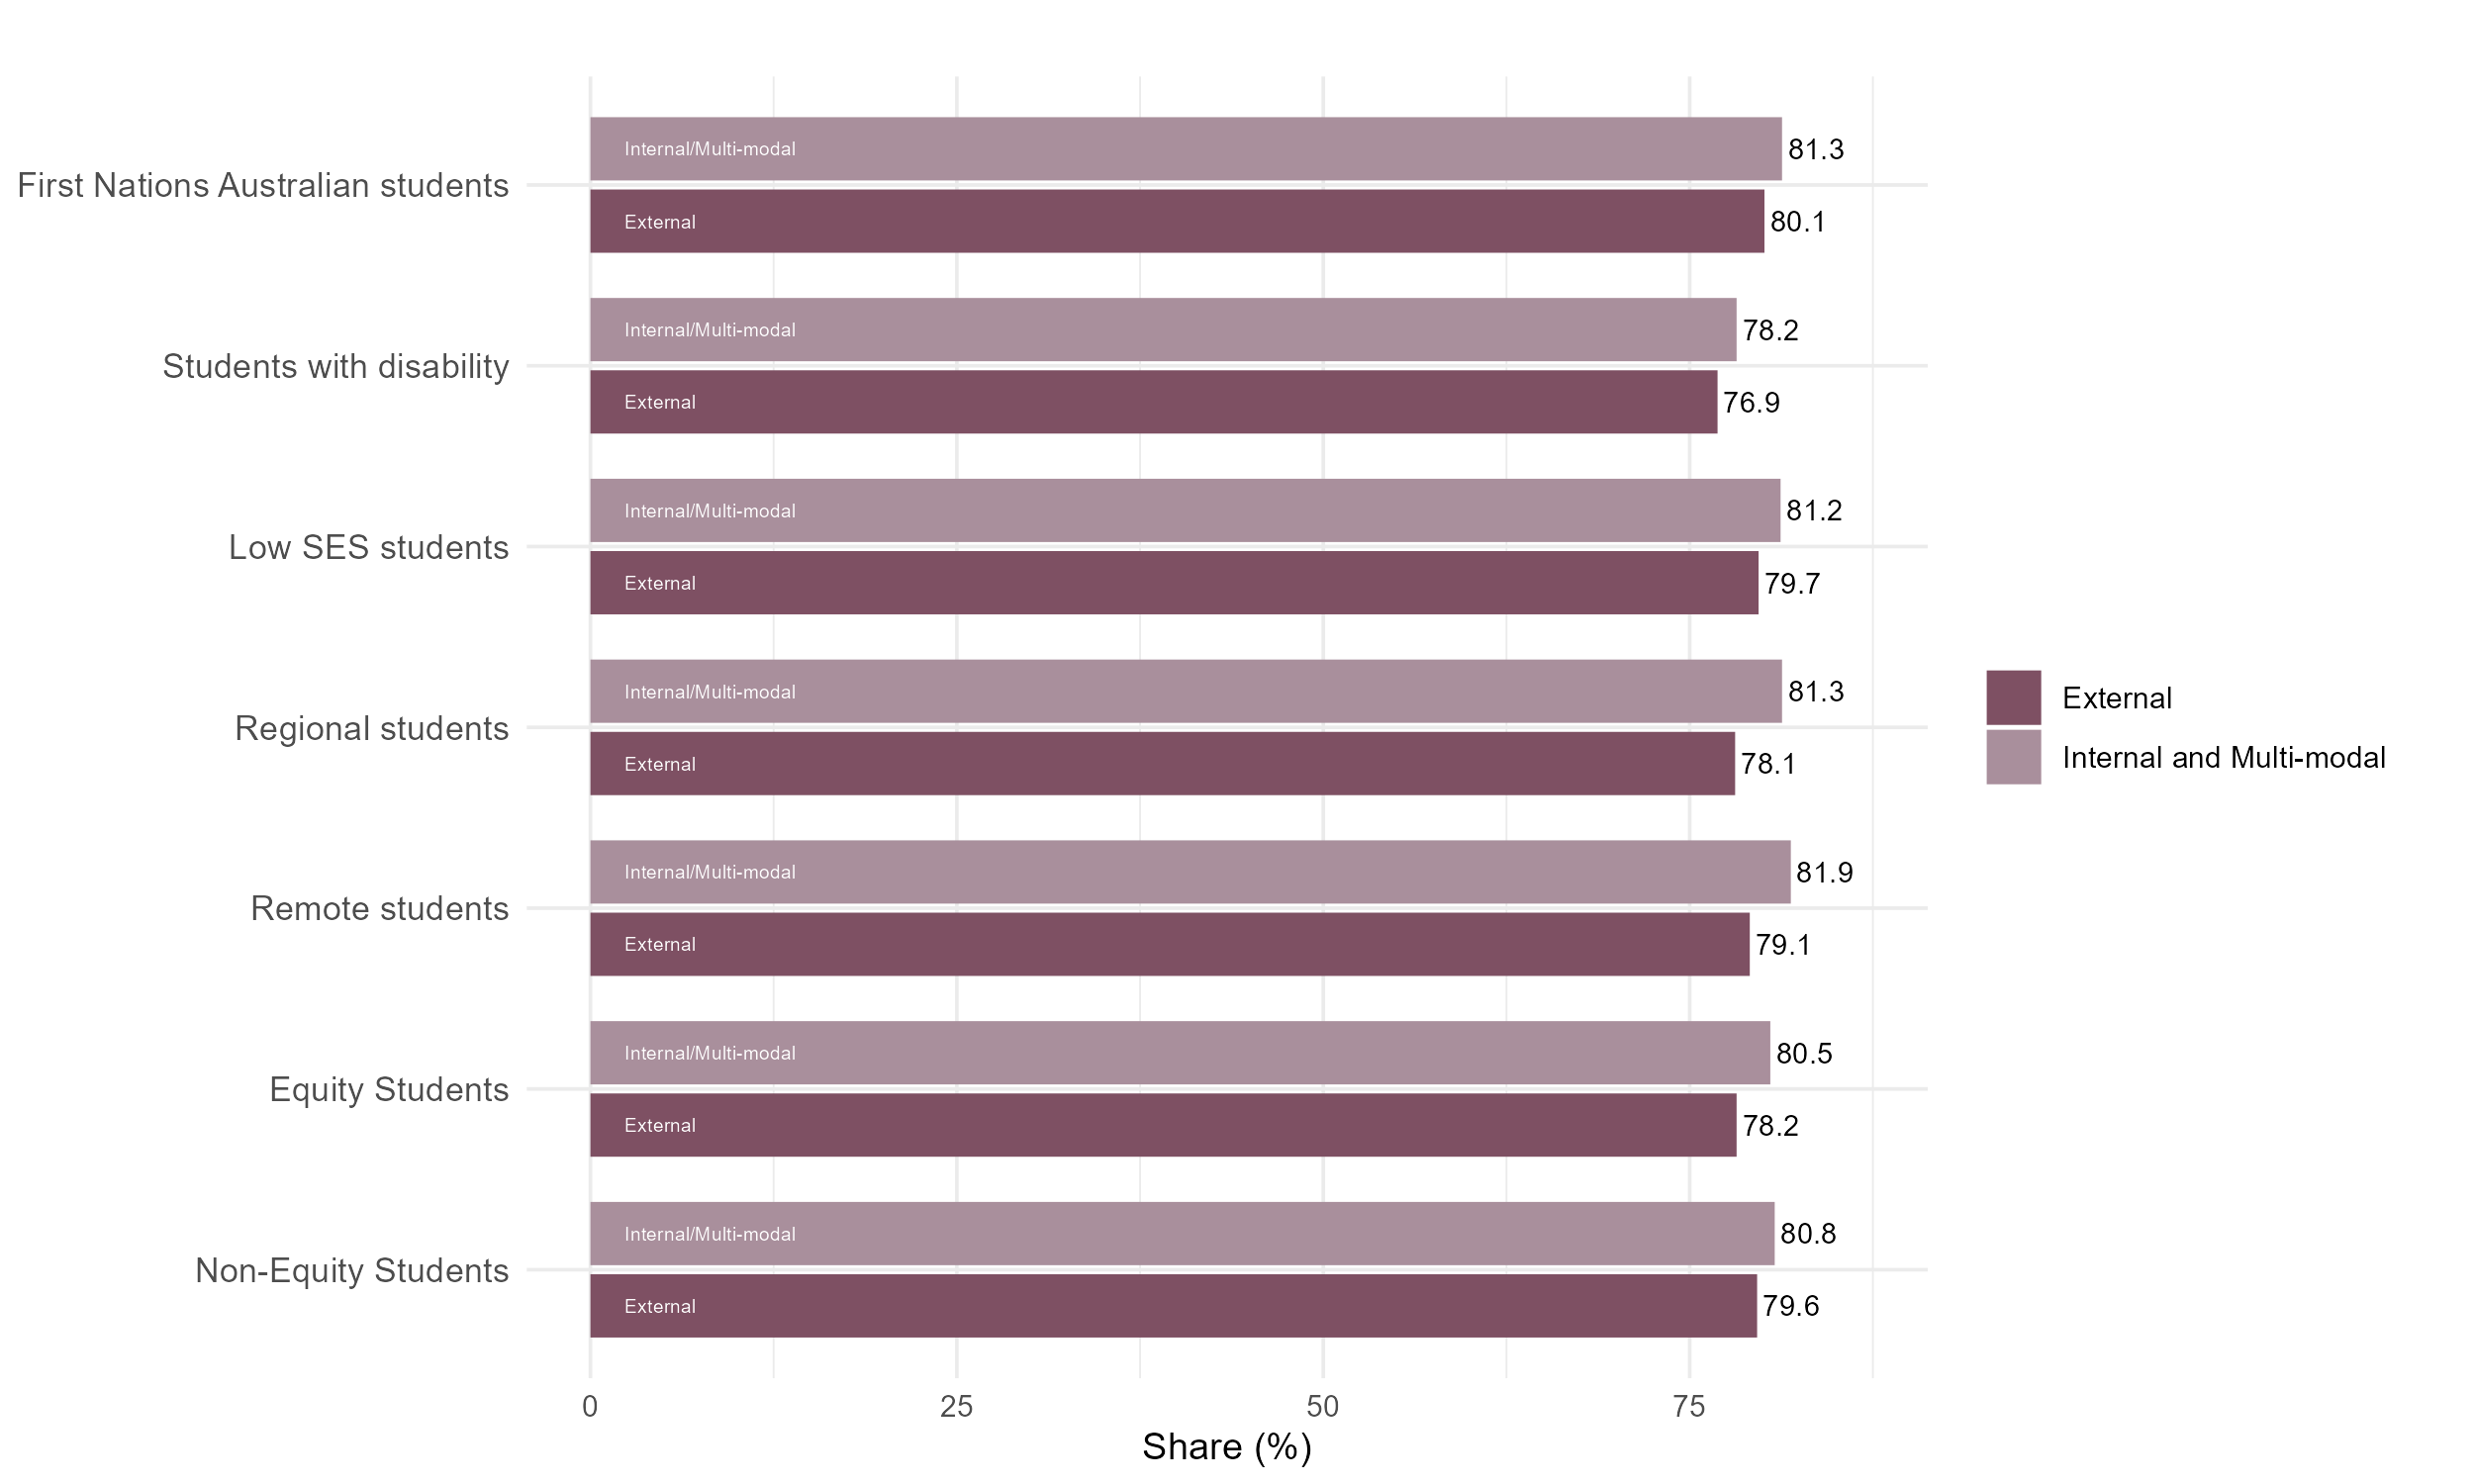
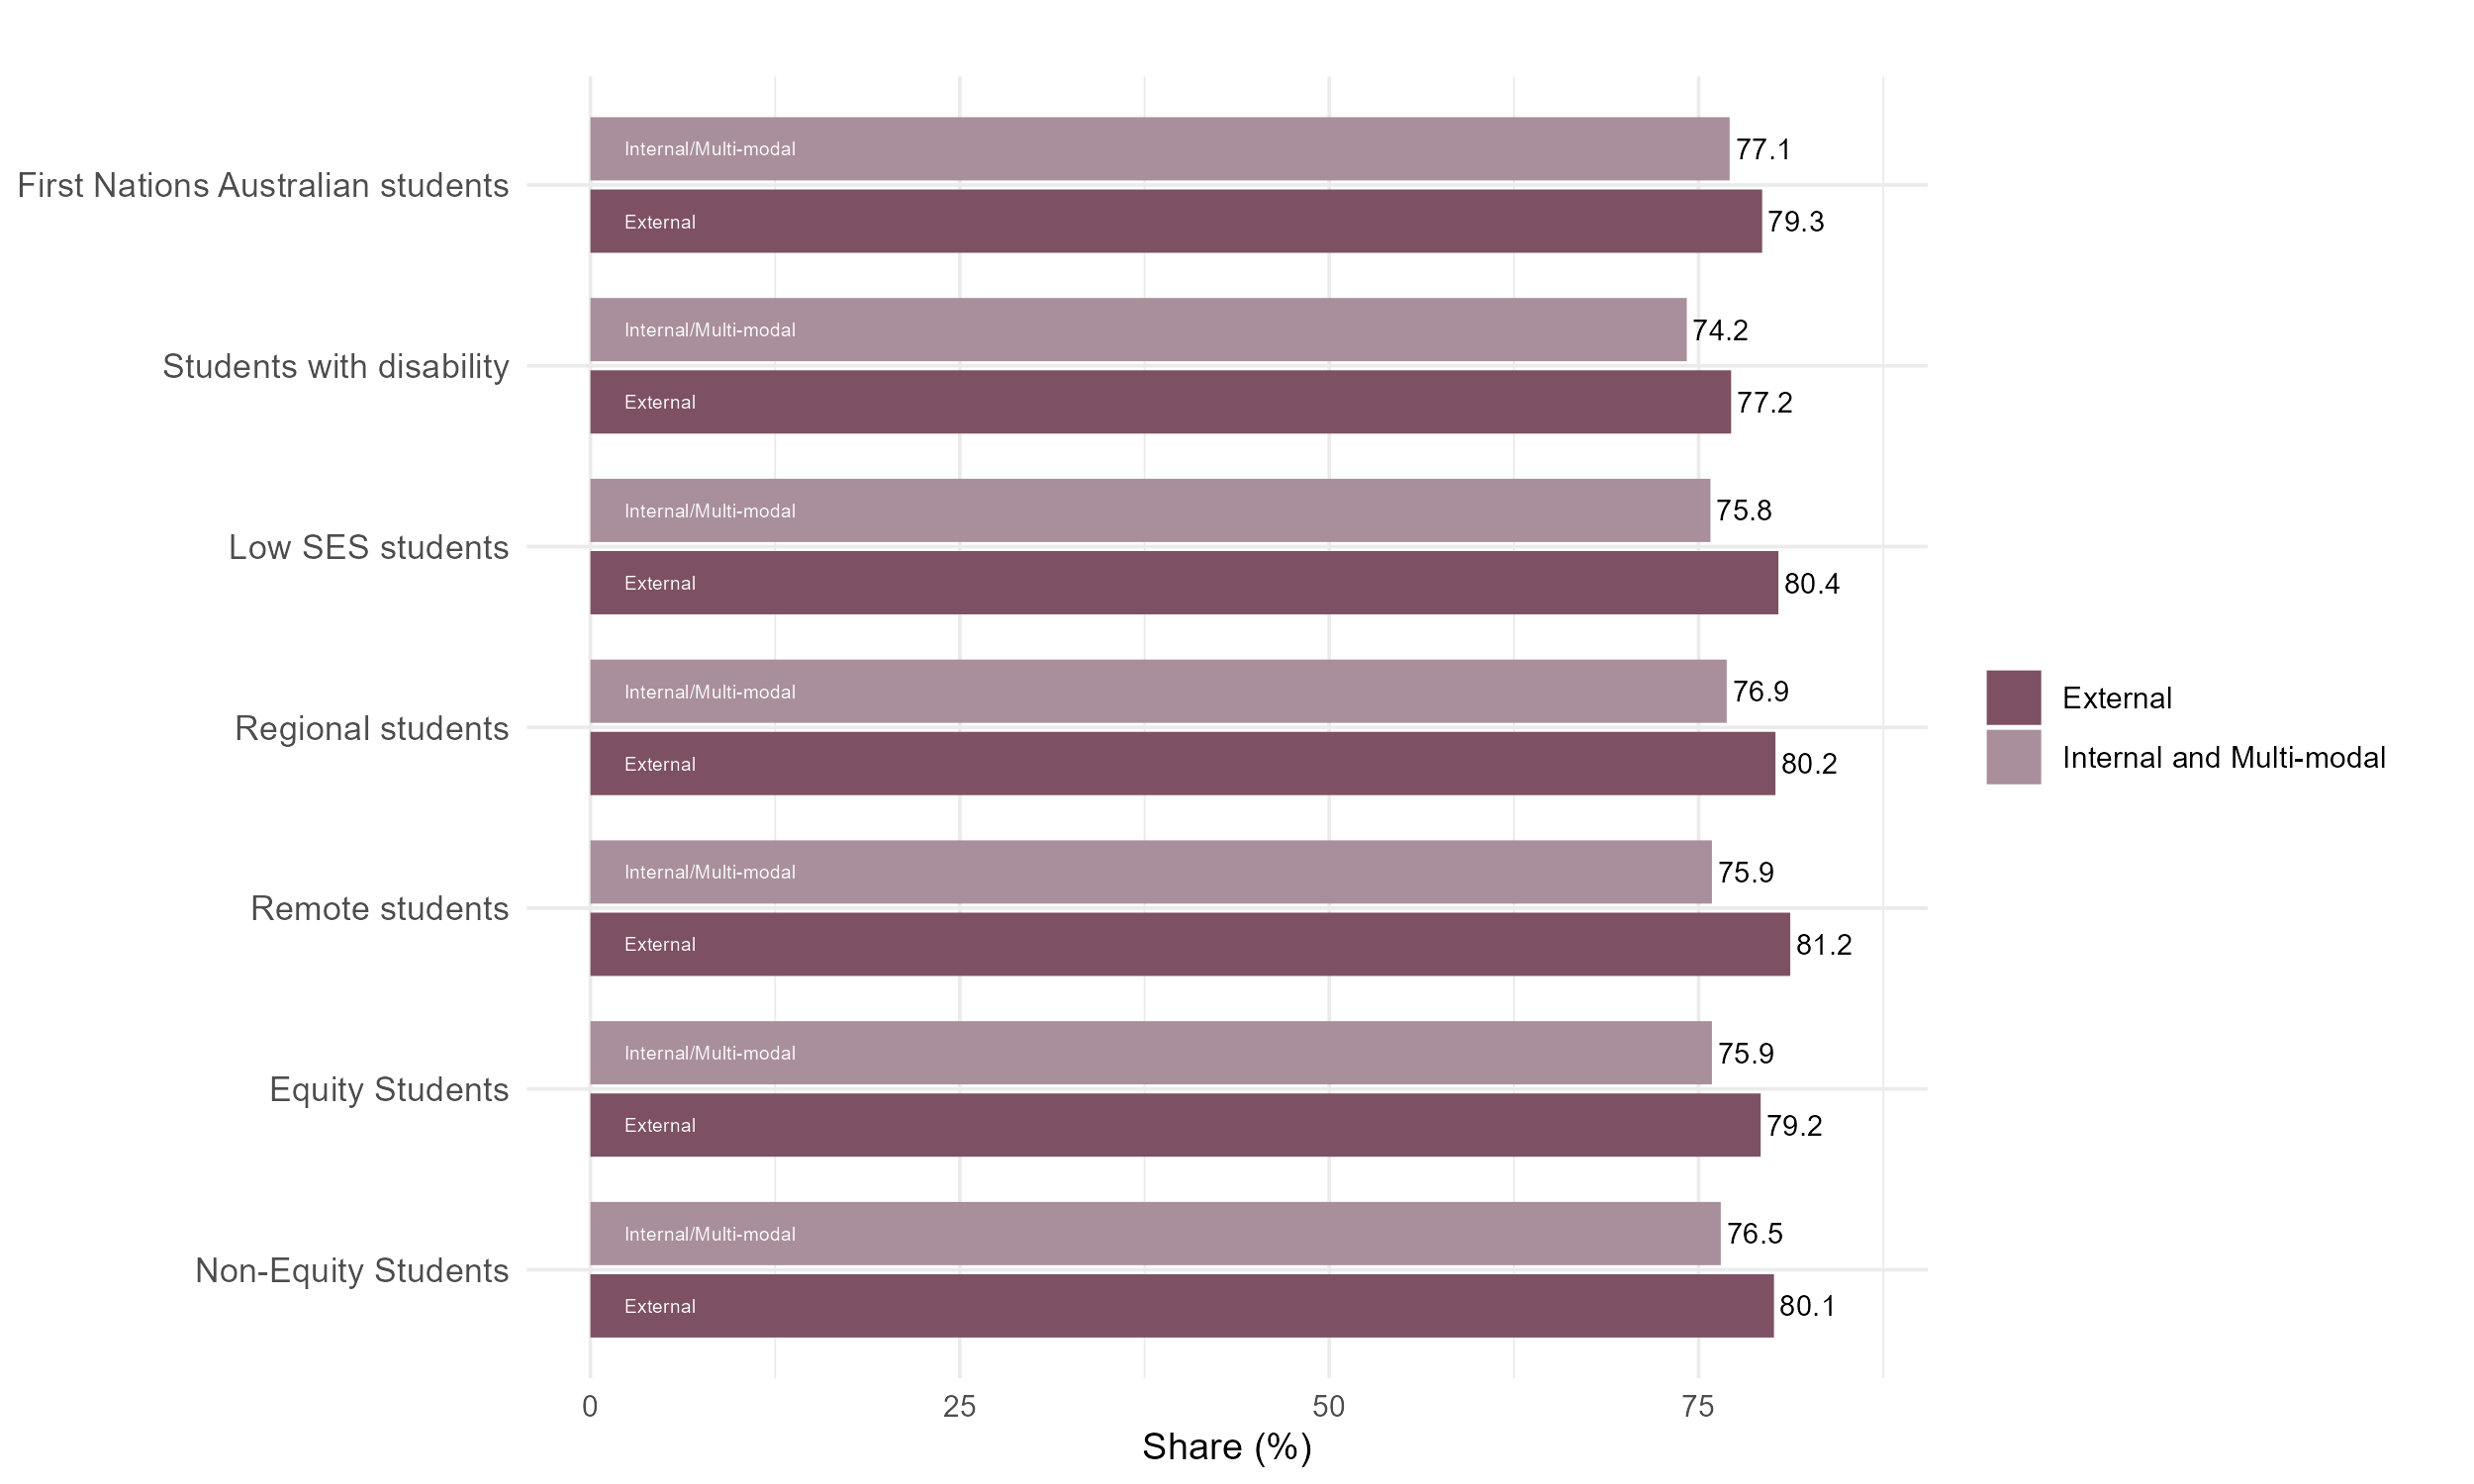
Lower sense of belonging for all students studying externally
Figure 17: Share of students who stated they have a sense of belonging to their institution, QILT Student Experience Survey, 2023.
Share of students who considered leaving their institution varies across equity students studying externally
Figure 18: Share of students who stated they seriously considered leaving their institution, QILT Student Experience Survey, 2023.
Slightly lower satisfaction with skills development for all students studying externally
Figure 19: Share of students who stated they were satisfied with skills development, QILT Student Experience Survey, 2023.
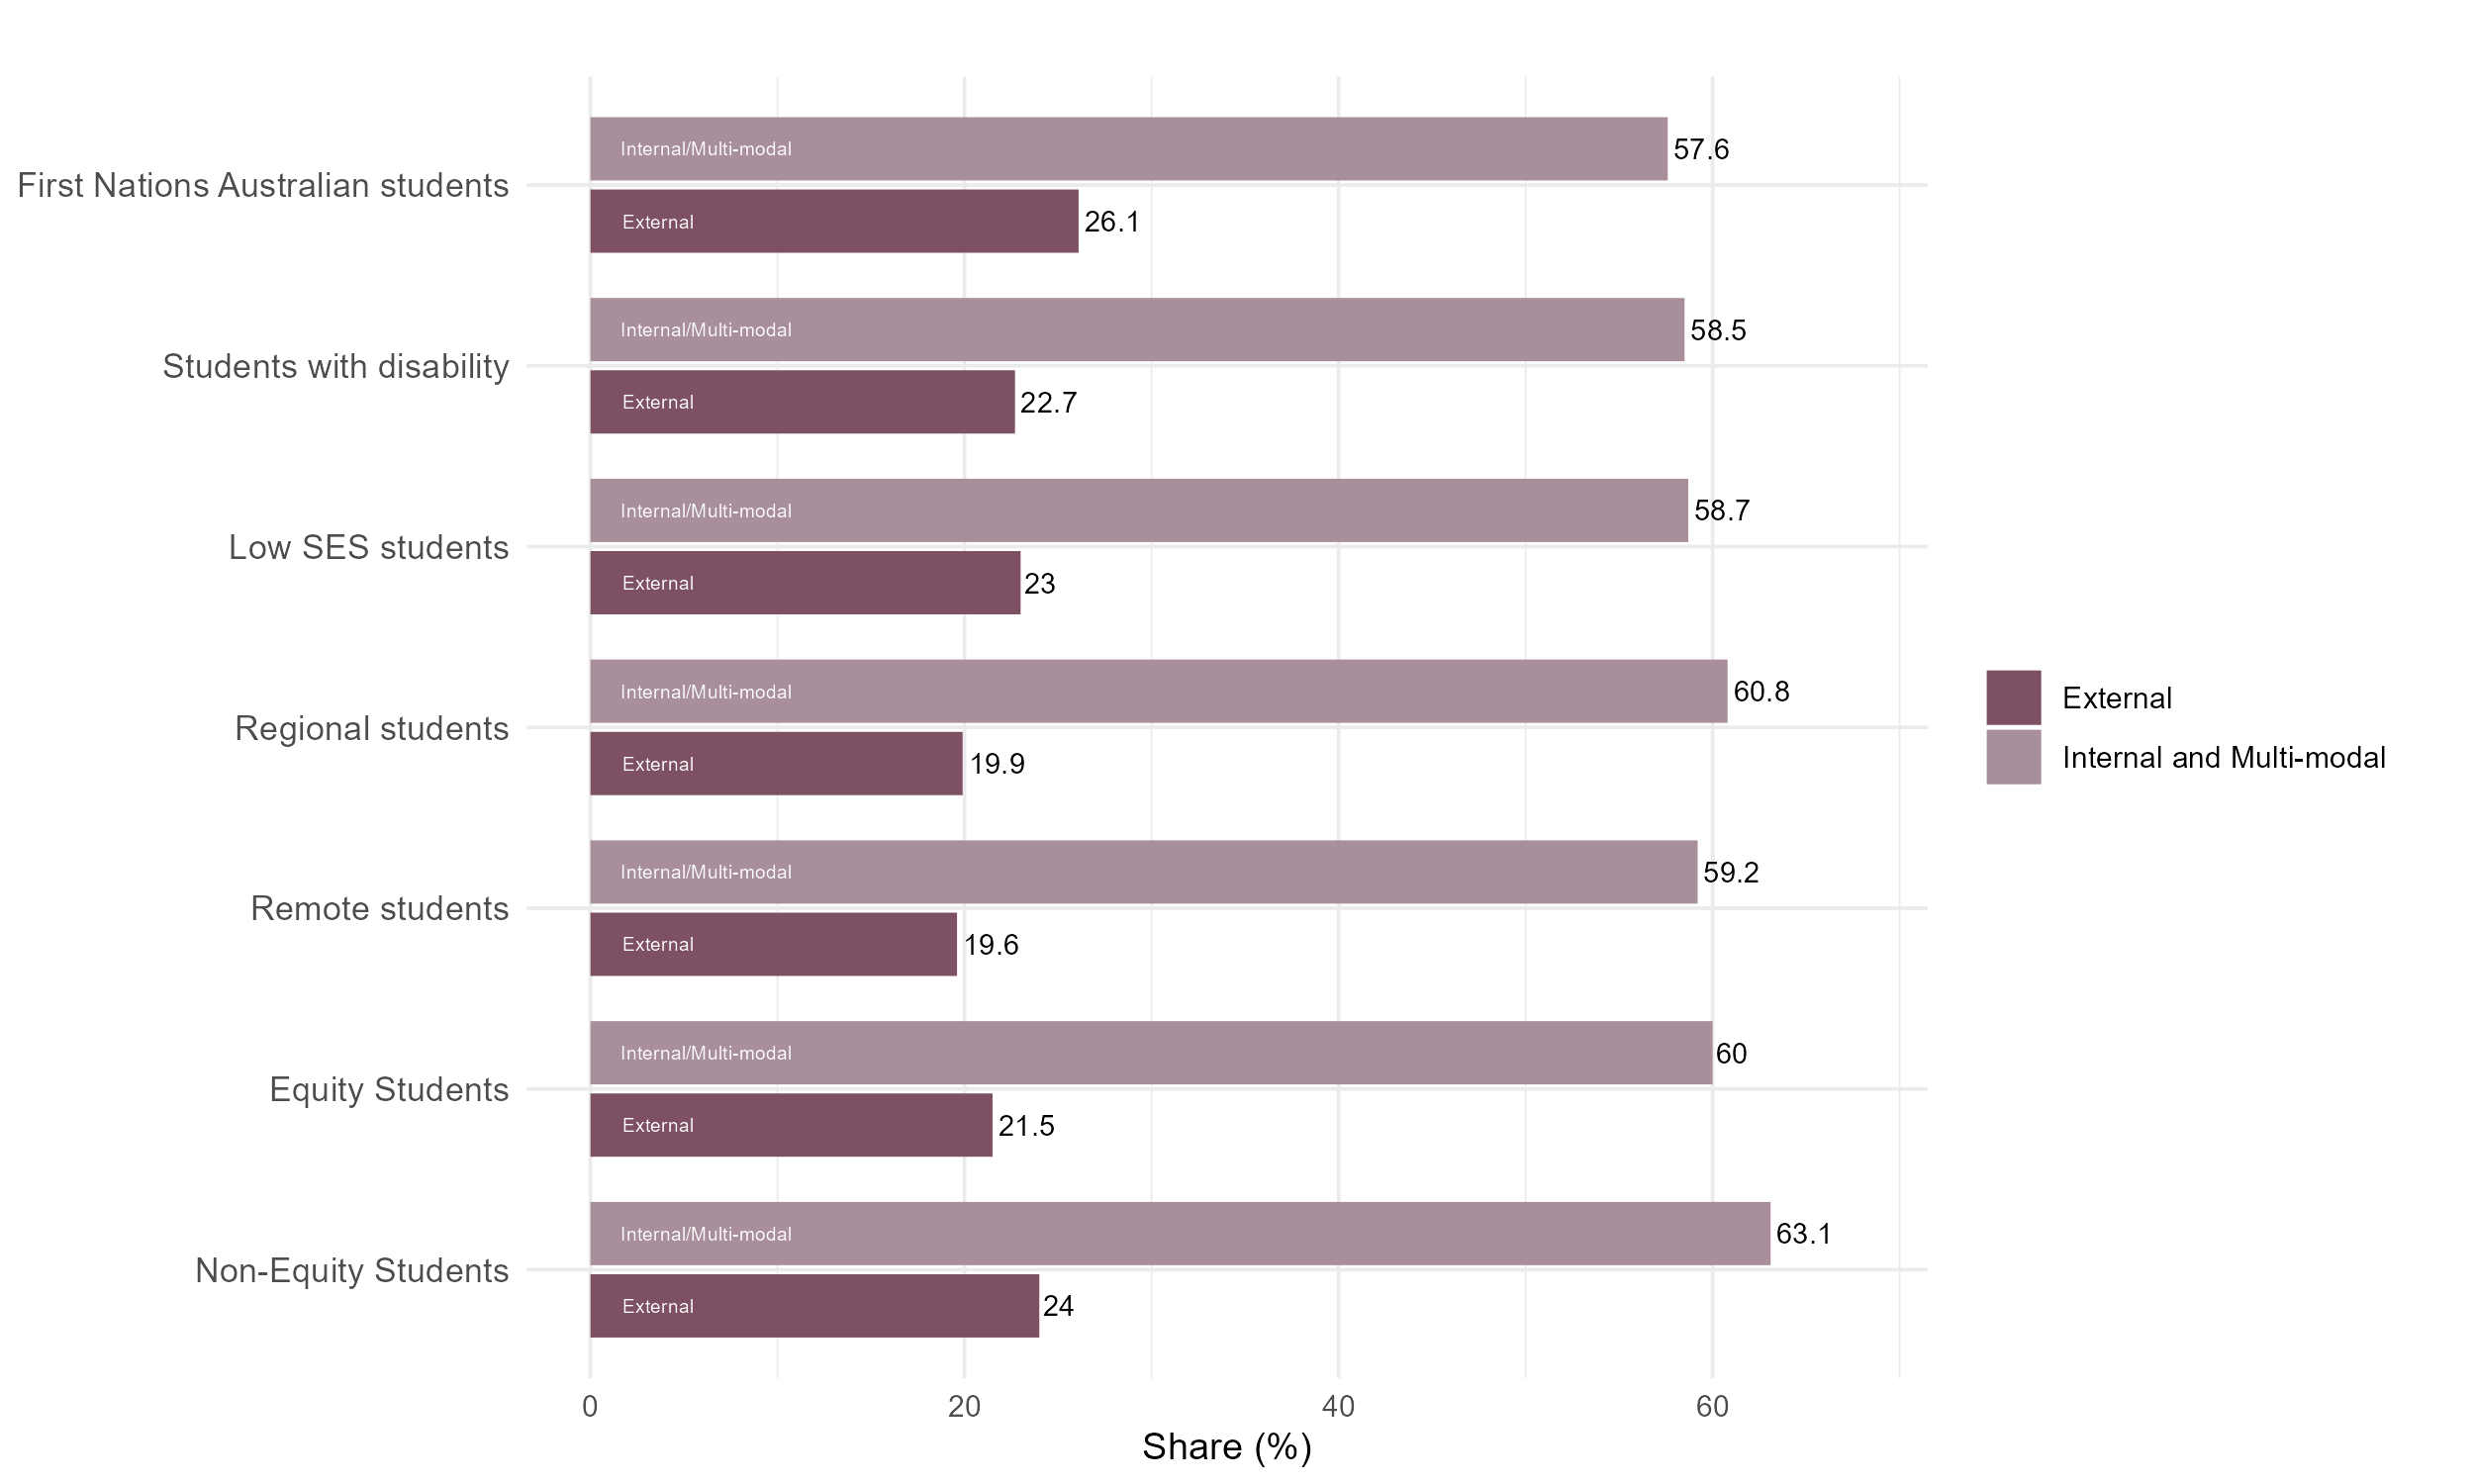
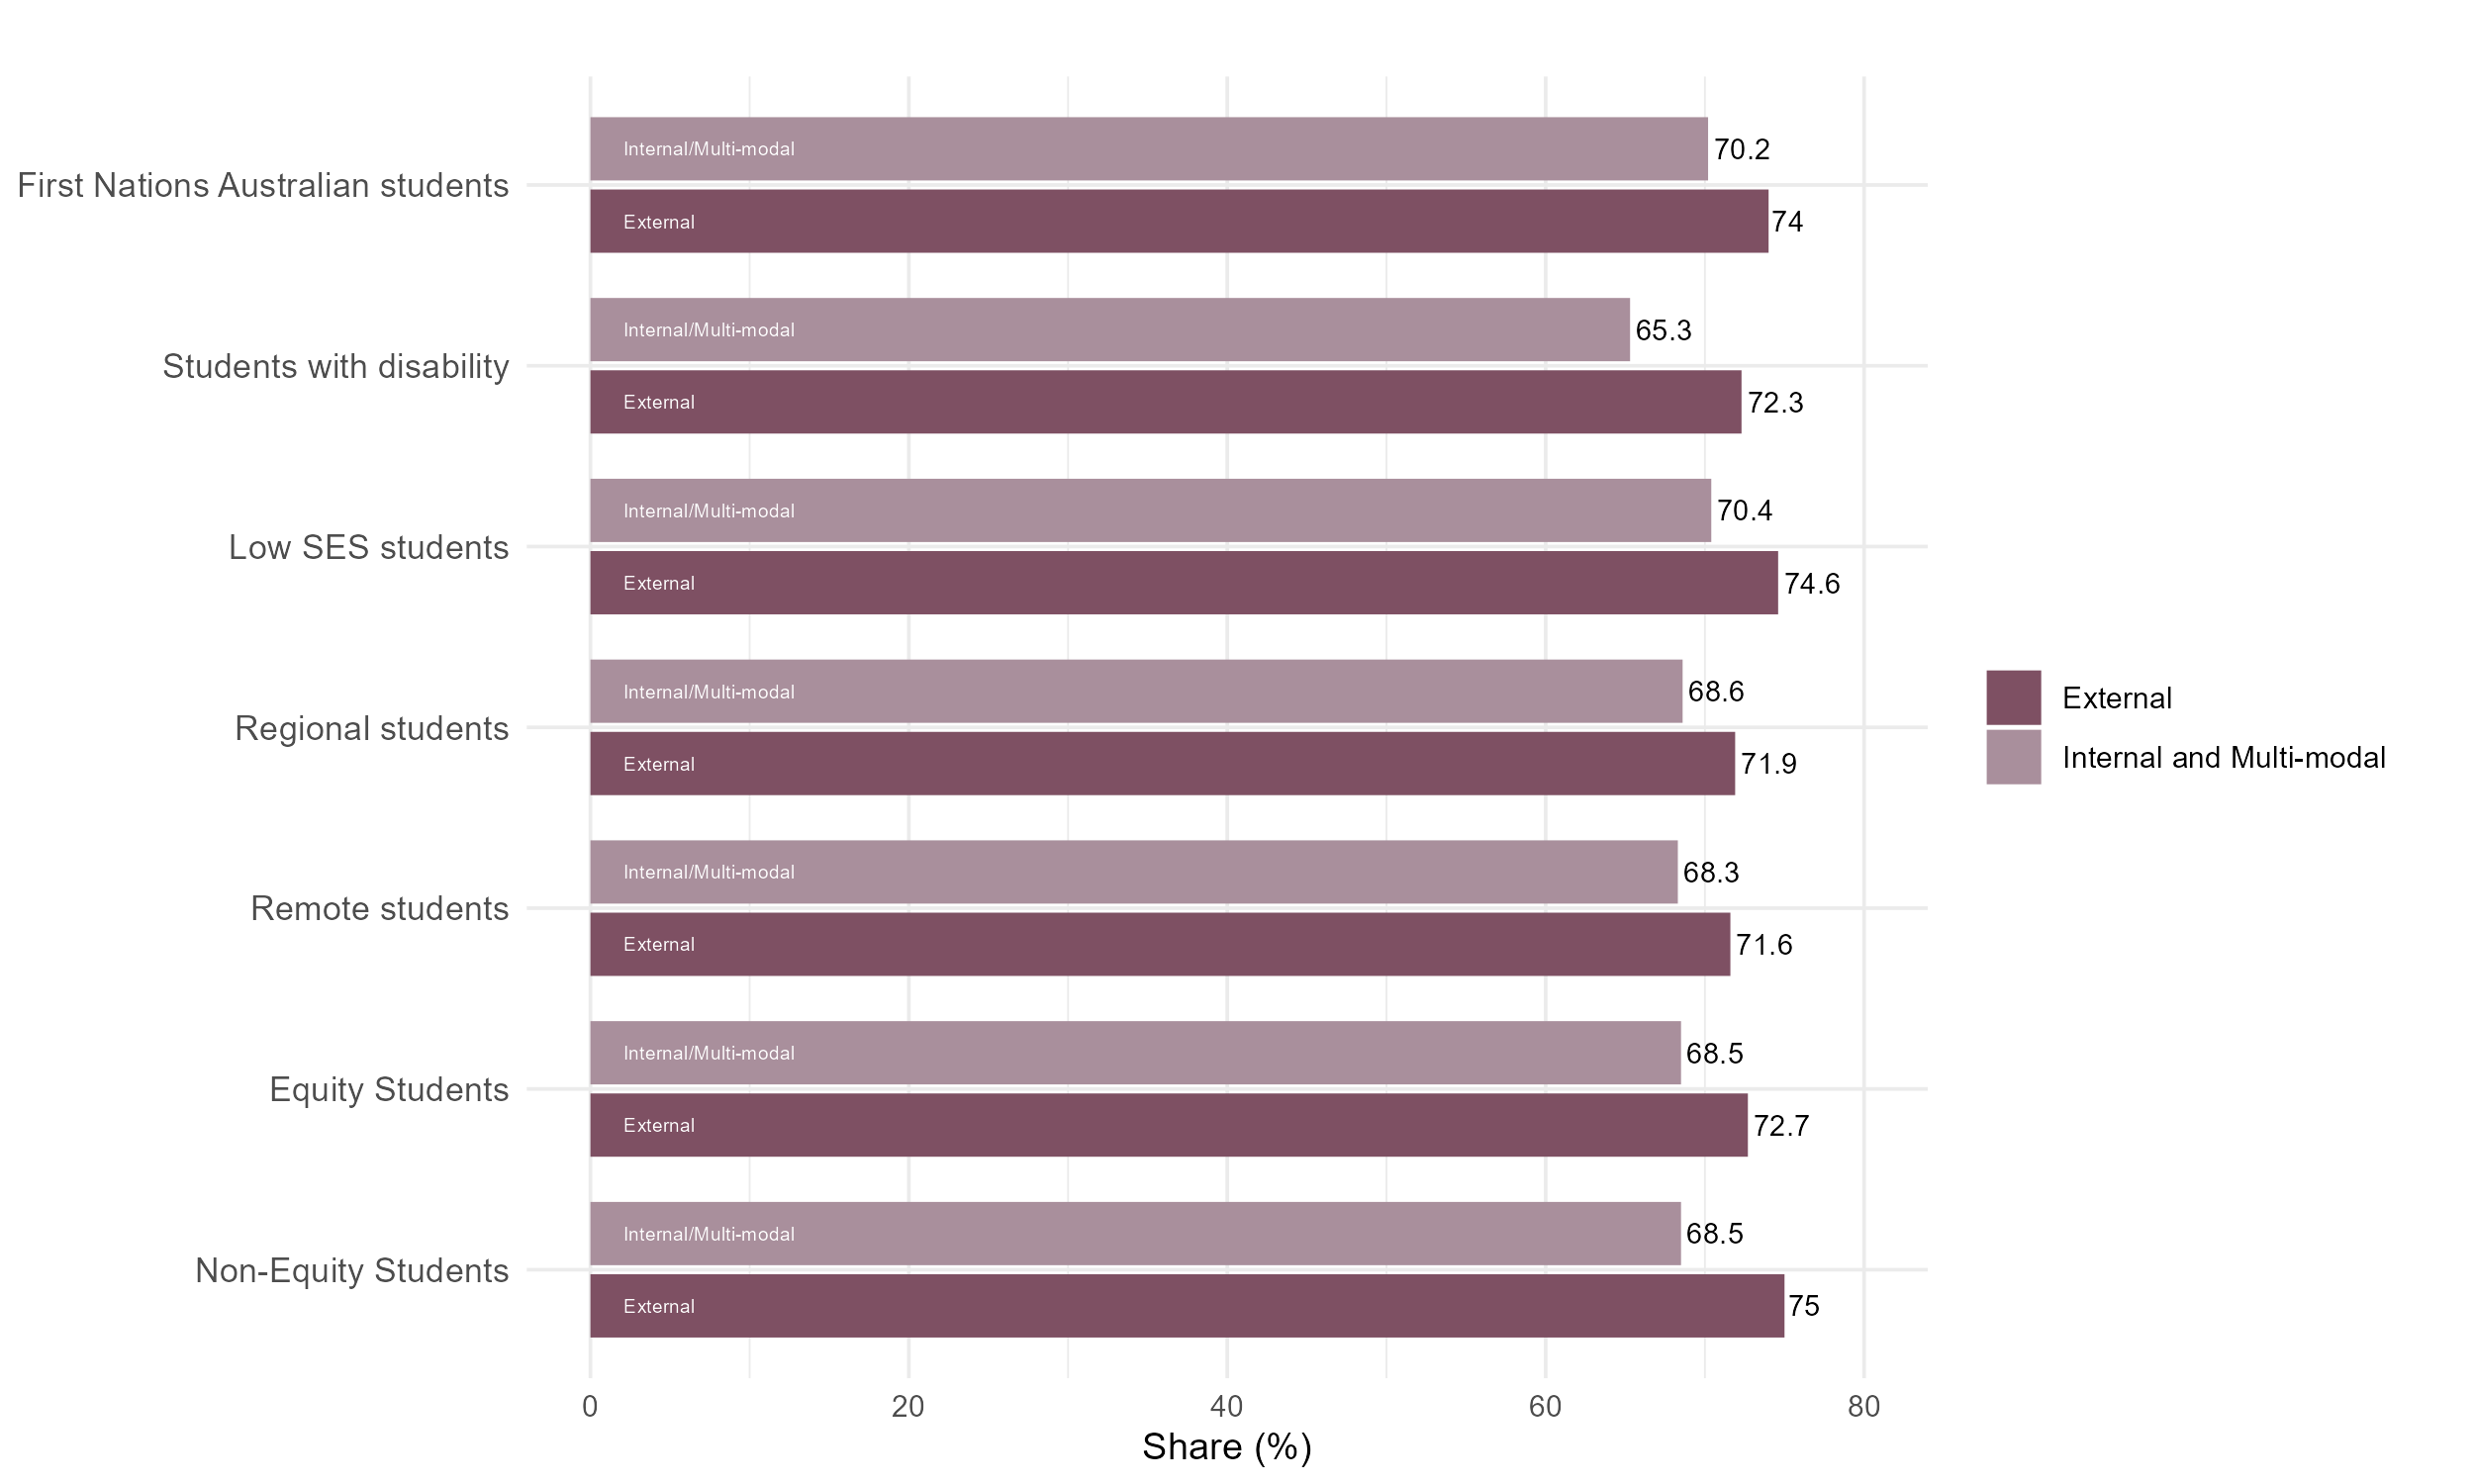
Substantially lower satisfaction with peer engagement for all students studying externally
Figure 20: Share of students who stated they were satisfied with peer engagement, QILT Student Experience Survey, 2023.
Lower share of students studying externally feel free to express their views
Figure 21: Share of students who stated they were free to express their views, QILT Student Experience Survey, 2023.
Share of students free from discrimination varies across student groups studying externally
Figure 22: Share of students who stated they were free from discrimination, QILT Student Experience Survey, 2023.
Lower share of students studying externally were satisfied with their freedom of expression
Figure 23: Share of students who stated they were satisfied with their freedom of expression, QILT Student Experience Survey, 2023.
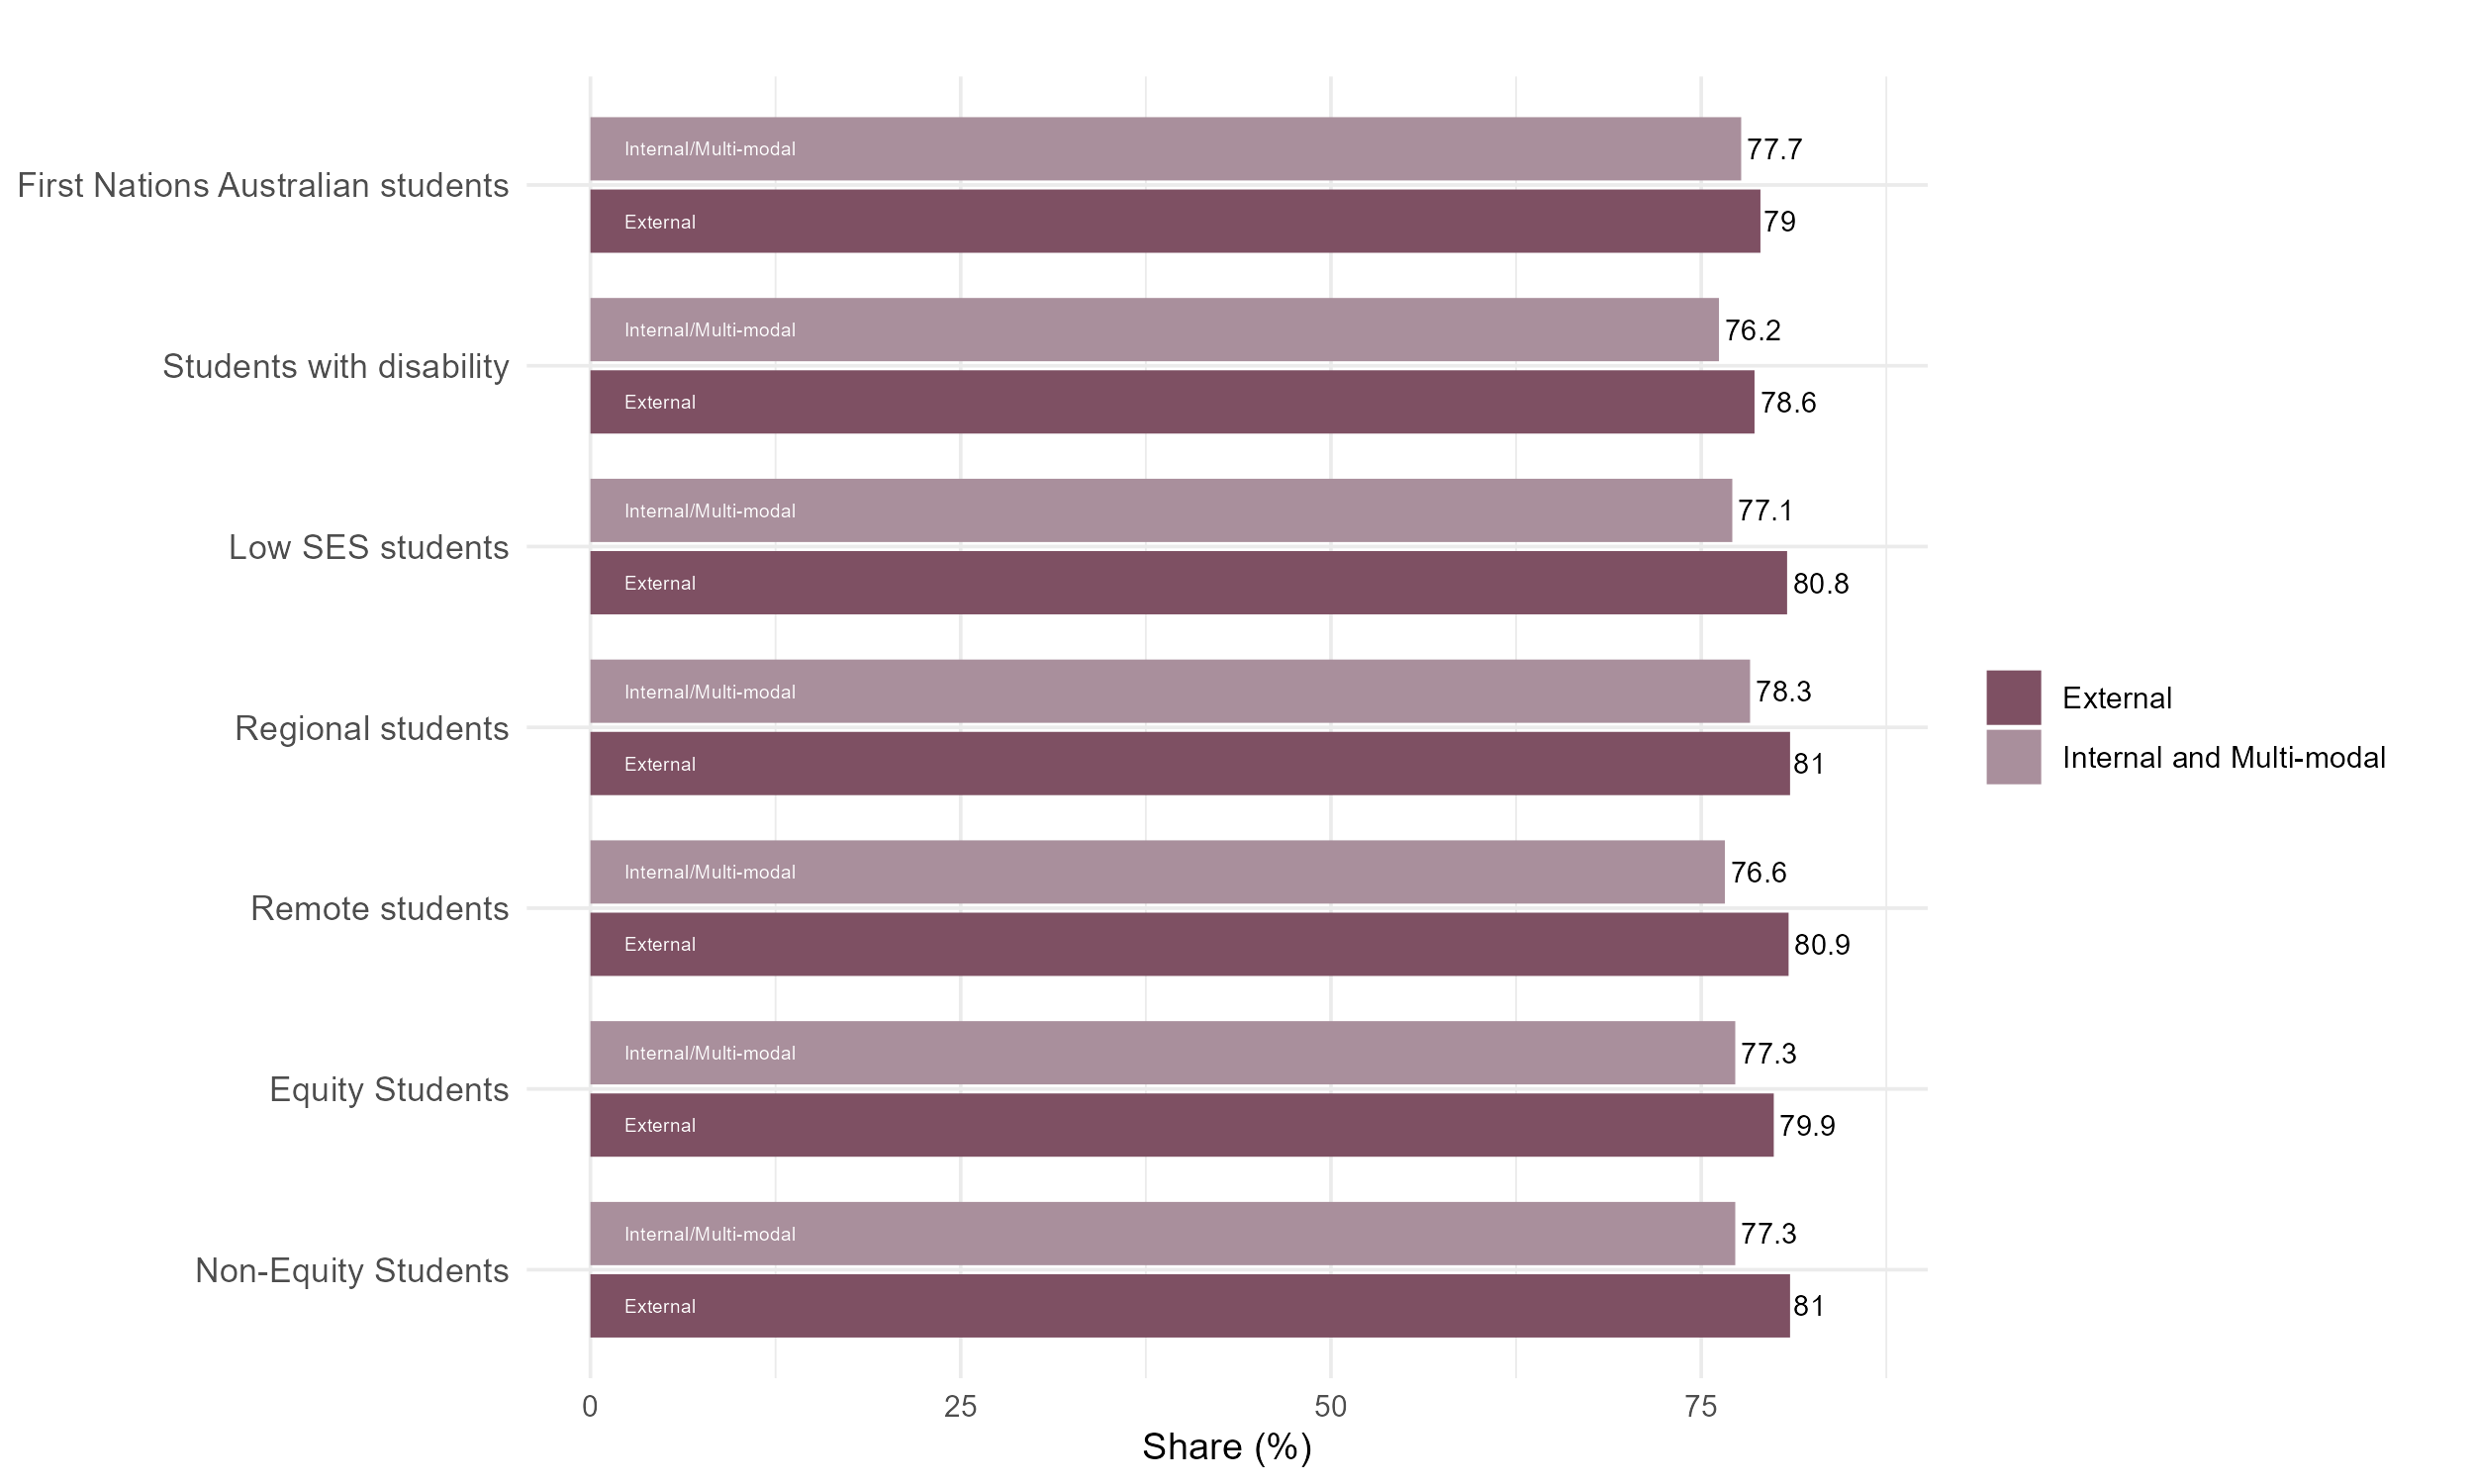
Higher share of students studying externally were satisfied with the quality of their entire educational experience
Figure 24: Share of students who stated they were satisfied with the quality of their entire educational experience, QILT Student Experience Survey, 2023.
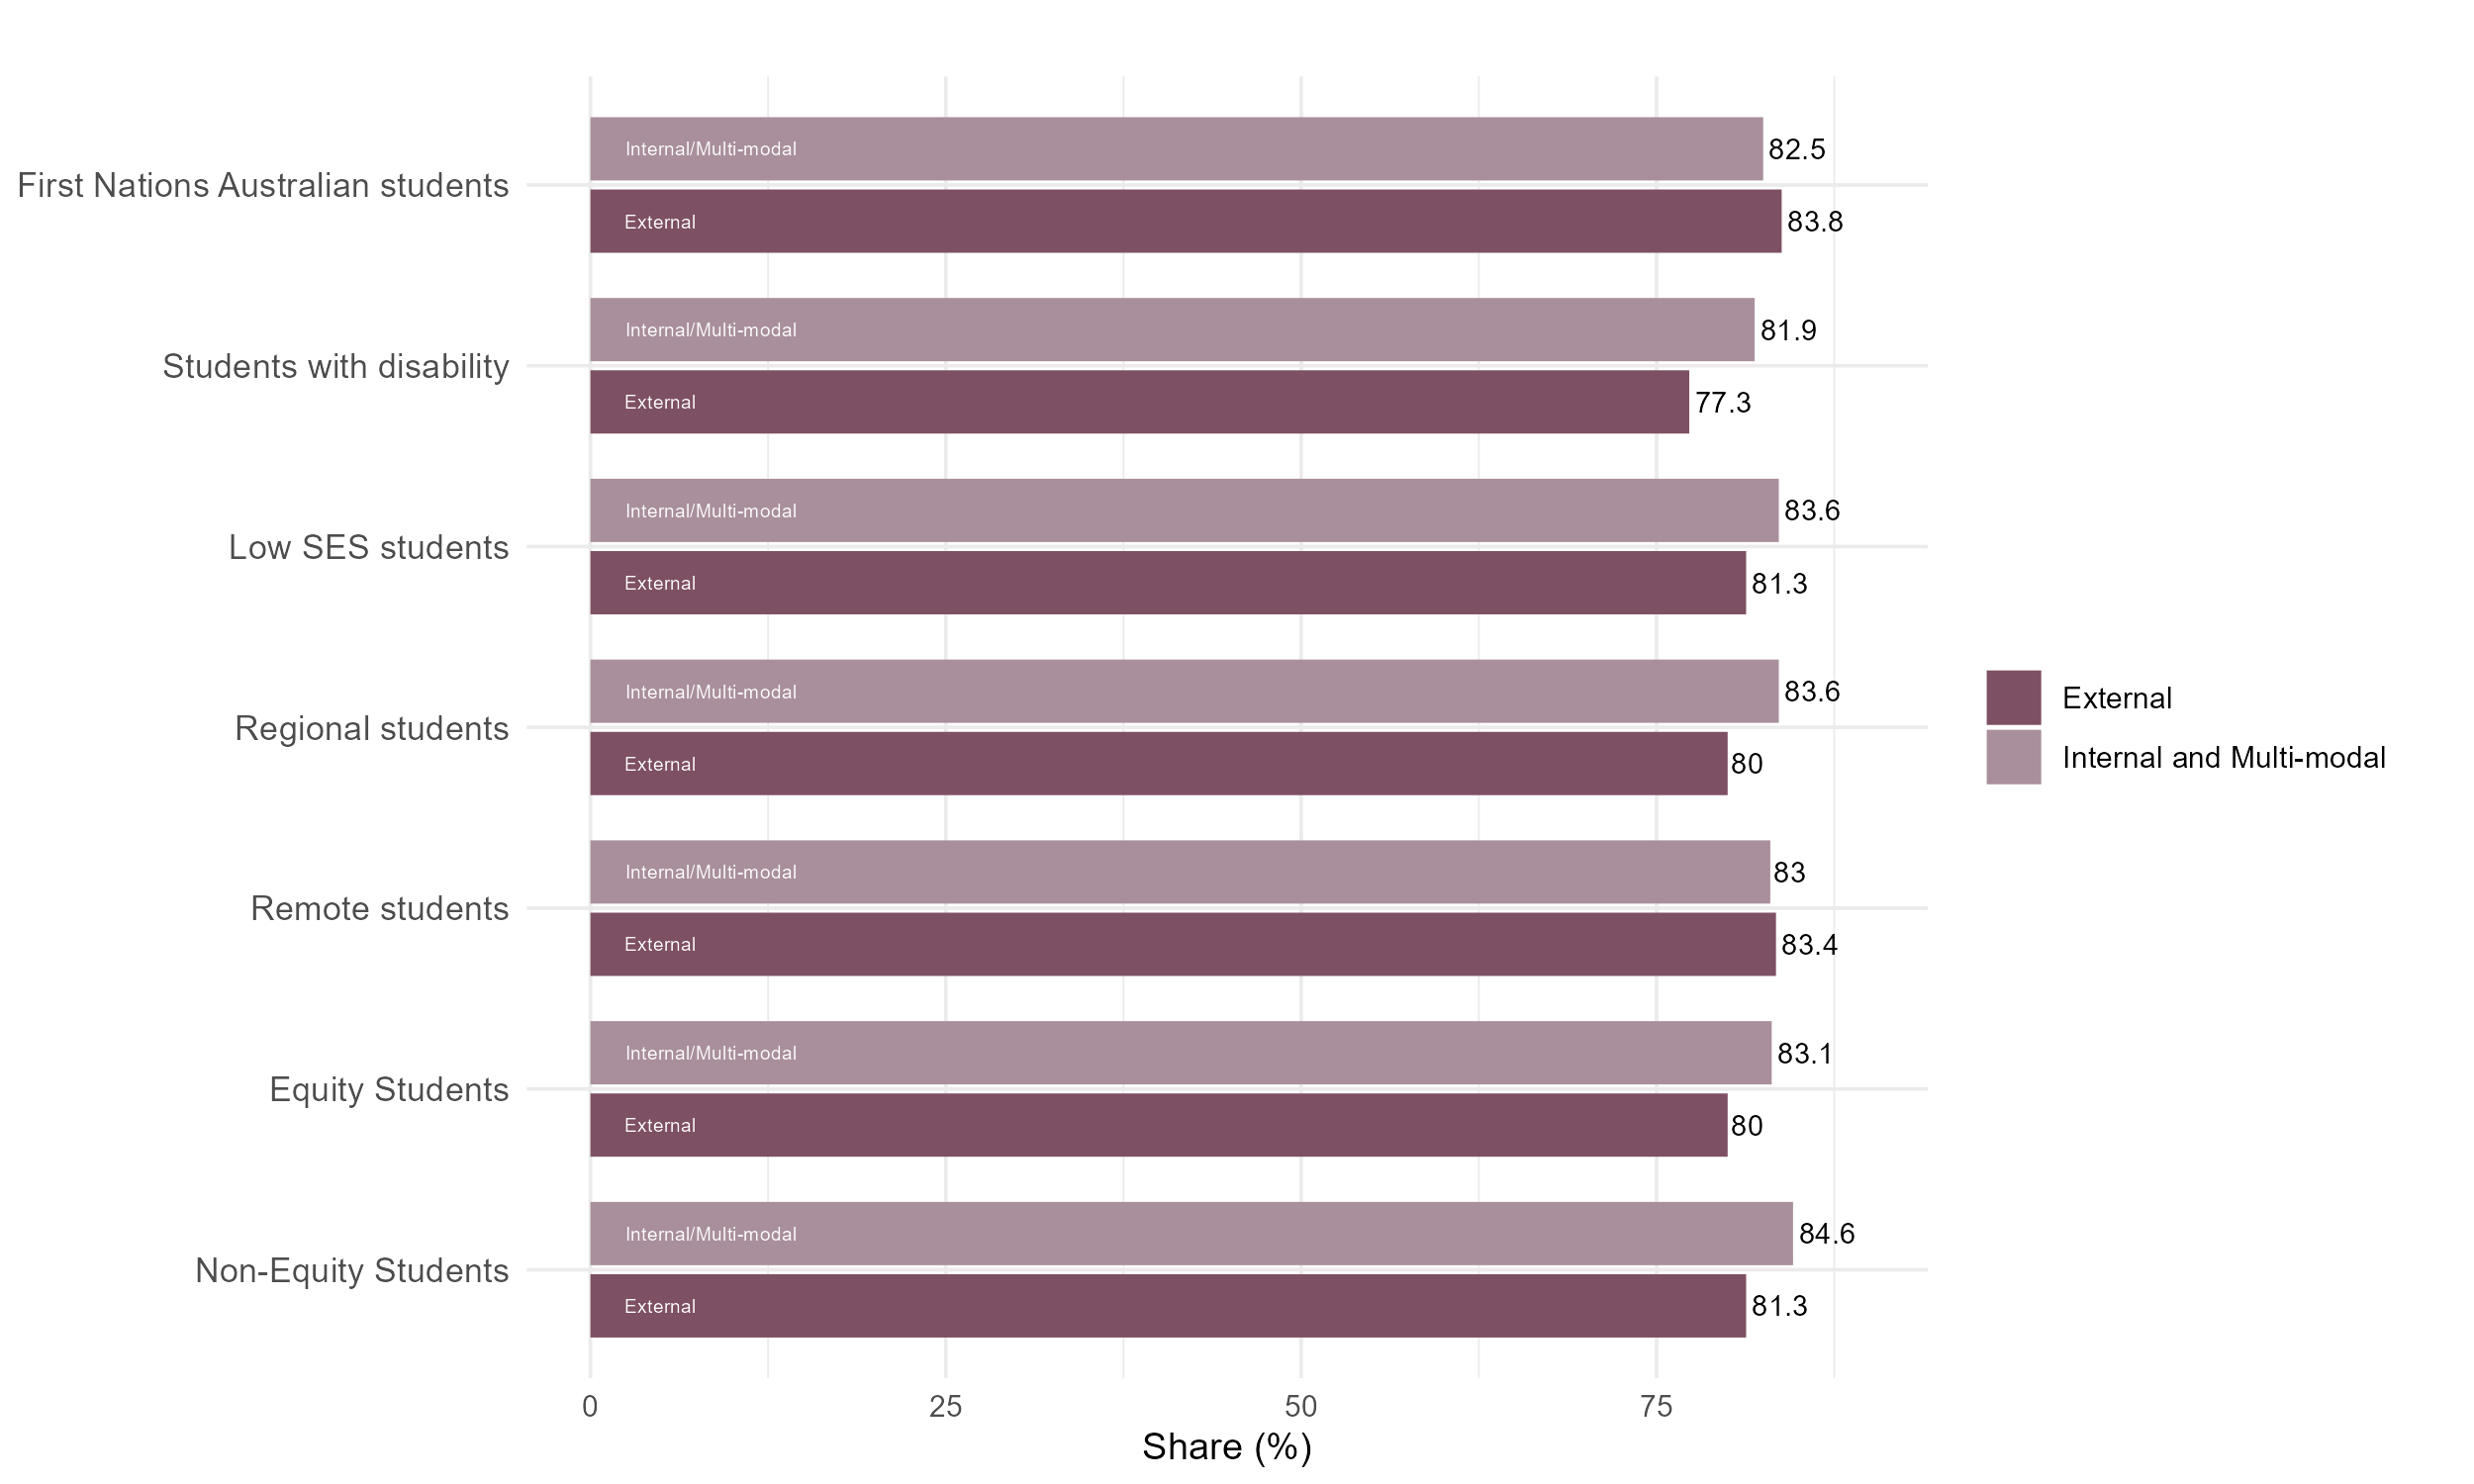
Higher share of students studying externally were satisfied with the quality of teaching
Figure 25: Share of students who stated they were satisfied with quality of teaching, QILT Student Experience Survey, 2023.
Share of students satisfied with learning resources varies across student groups studying externally
Figure 26: Share of students who stated they were satisfied with learning resources, QILT Student Experience Survey, 2023.
Higher share of students studying externally were satisfied with student support and services
Figure 27: Share of students who stated they were satisfied with student support and services, QILT Student Experience Survey, 2023.
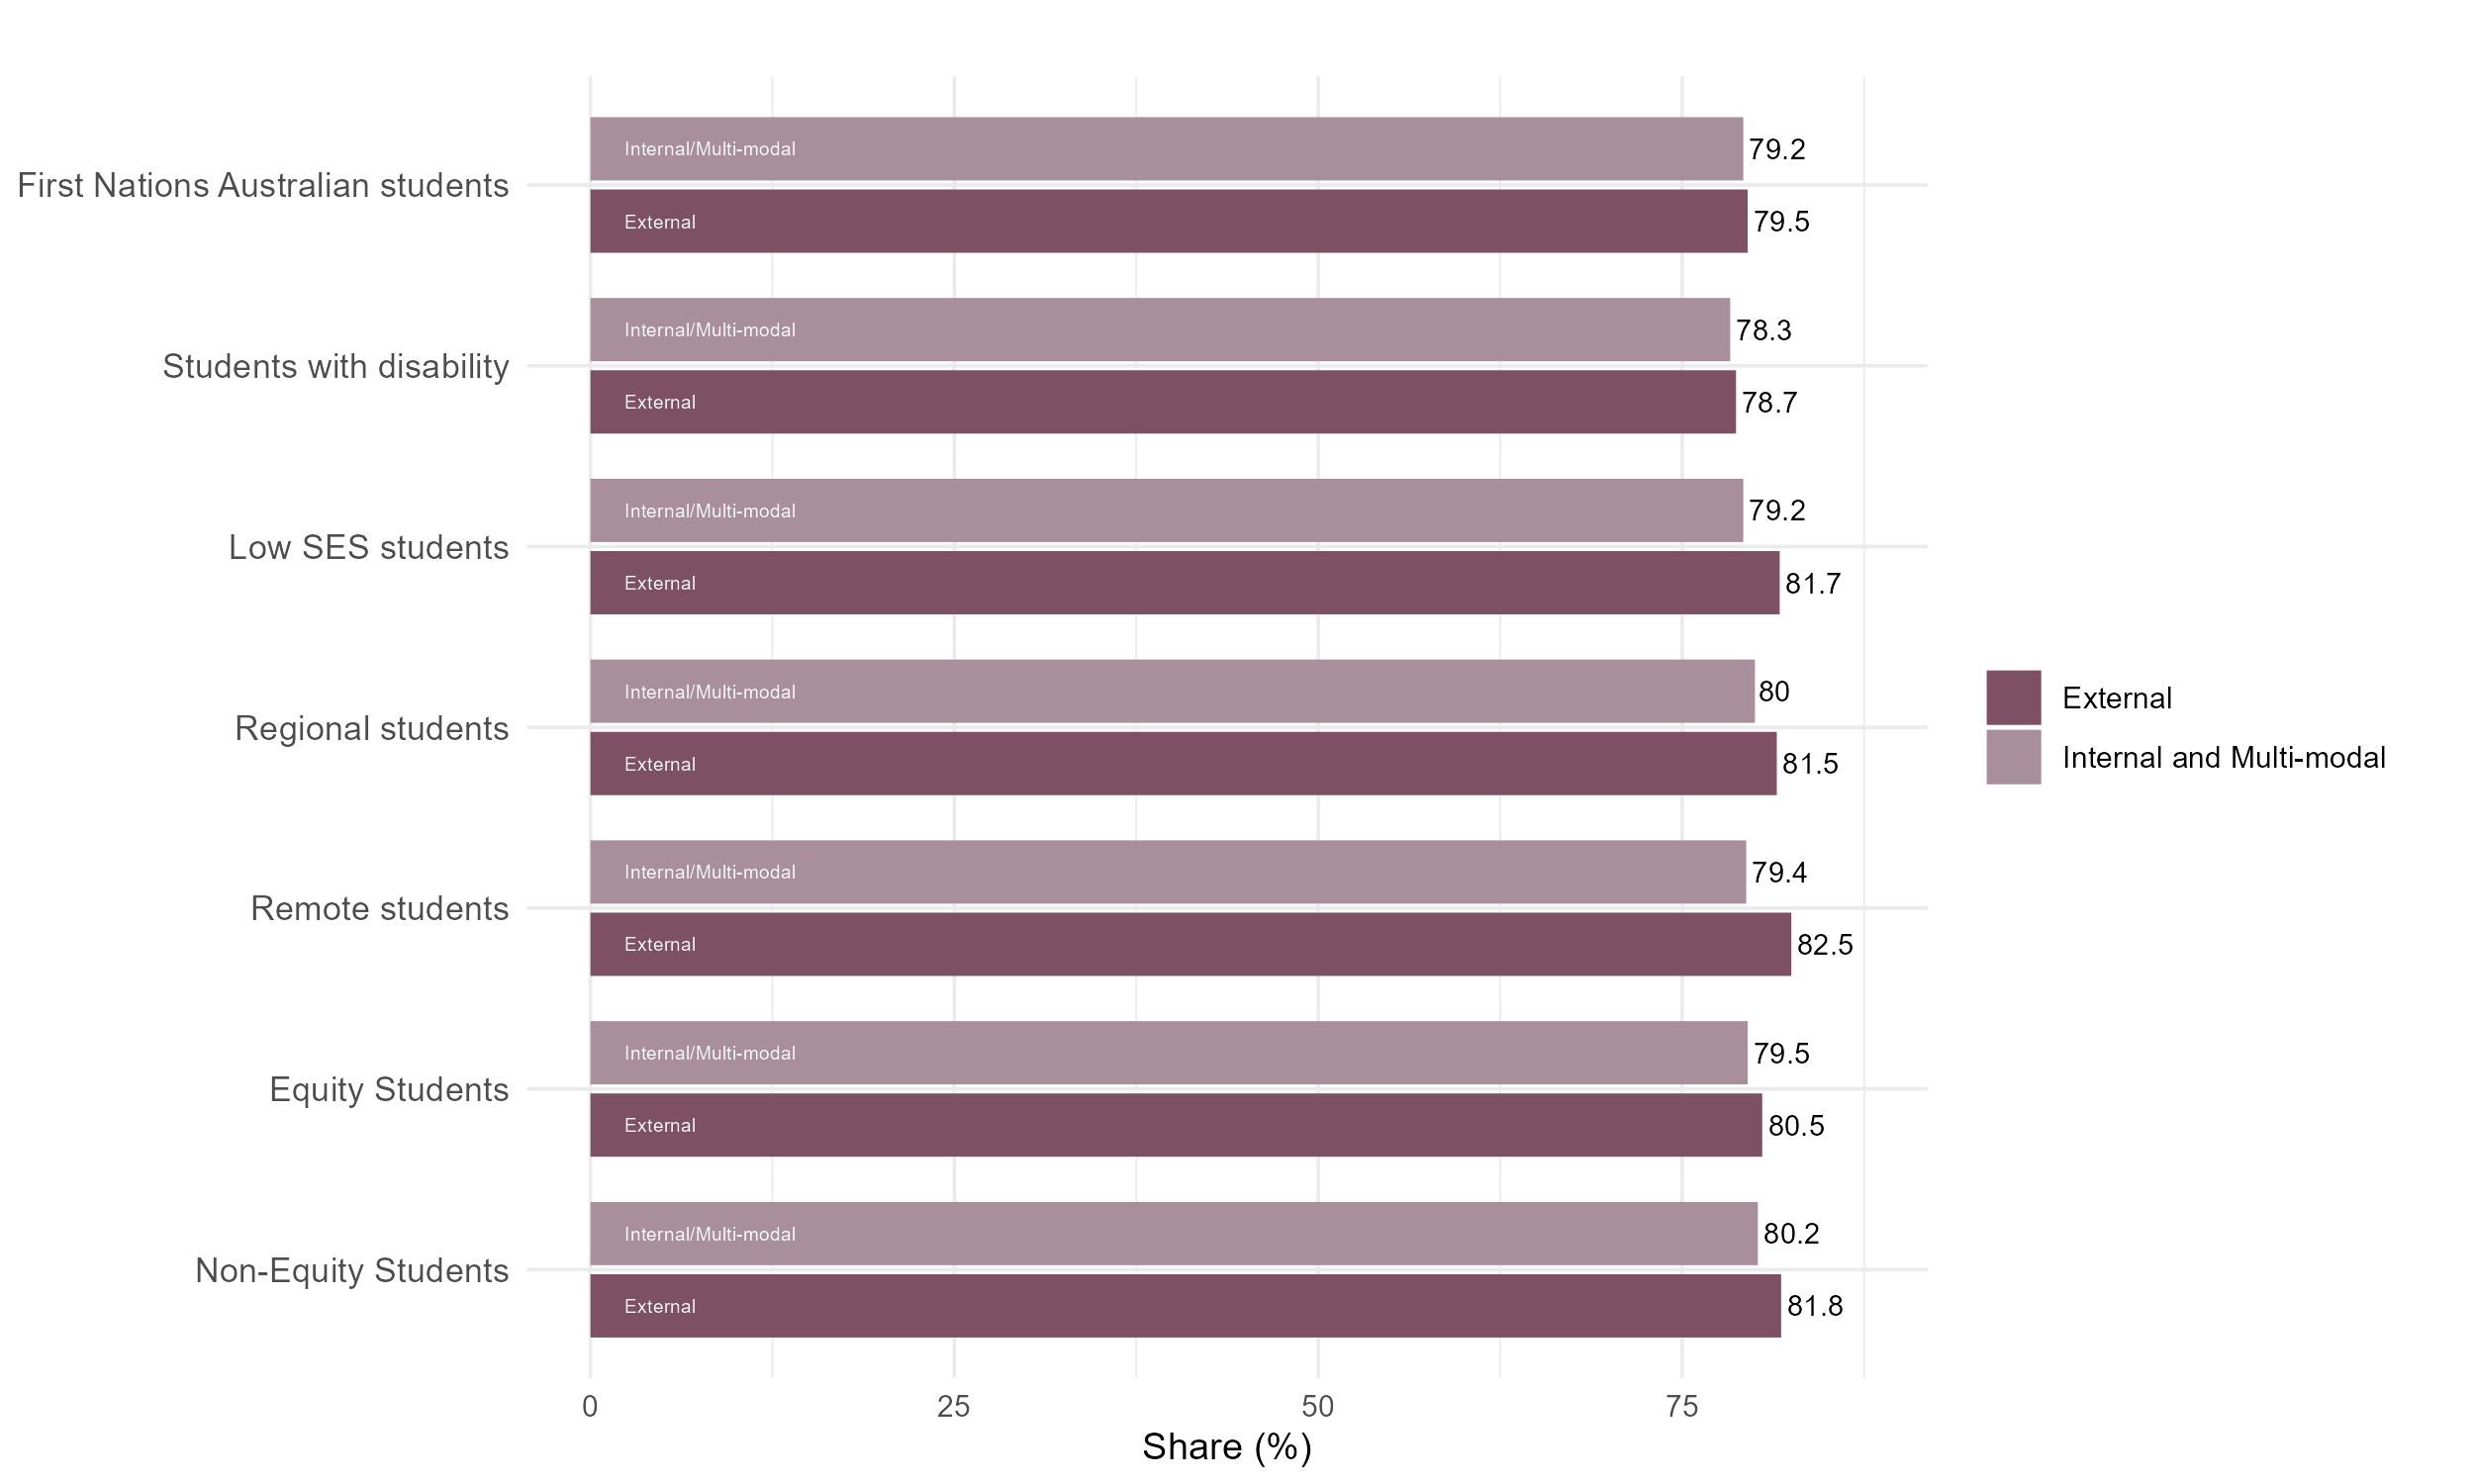
Slightly higher share of students studying externally were satisfied with teaching quality and engagement
Figure 28: Share of students who stated they were satisfied with teaching quality and engagement, QILT Student Experience Survey, 2023.
Acknowledgements
This report was prepared by the Data Program of the Australian Centre for Student Equity and Success (ACSES) at Curtin University.
The authors would like to acknowledge the staff at ACSES for their comments and assistance in the production of this publication and extend thanks to the Australian Government Department of Education for the provision of student equity data.
The report may be cited as: ACSES Data Program. (2025). Mode of attendance in Australian higher education from 2021 to 2023. Australian Centre for Student Equity and Success (ACSES), Perth: Curtin University.
This report focuses on changes in mode of attendance among domestic undergraduate students over the past three years, with a focus on the 2023 period. For further information on retention, participation, success, six- and nine-year cohort completion — please see the ACSES Student Equity Data Interactive Tool.
Copyright ownership of this material resides with Curtin University.
ISBN – 978-0-6454877-7-0
[1] Australian Government Department of Education (2024). Equity Group Statistics, Private Request (October 2024). Canberra: Department of Education.
[2] Social Research Centre (2025). Equity Group Statistics, Private Request (April 2025).
[6] Stone, C. (2022). 38(6). From the margins to the mainstream: The online learning rethink and its implications for enhancing student equity. Australasian Journal of Educational Technology Stone, C. (2022). From the margins to the mainstream: The online learning rethink and its implications for enhancing student equity. Australasian Journal of Educational Technology, 38(6), 151–165. https://doi.org/10.14742/ajet.8136
[7] O’Shea, S., May, J., Stone, C., Delahunty, J. (2024). The Online Student Experience: New Challenges for Engagement and Support. In: First-in-Family Students, University Experience and Family Life. Palgrave Macmillan, Cham. https://doi.org/10.1007/978-3-031-34451-0_6